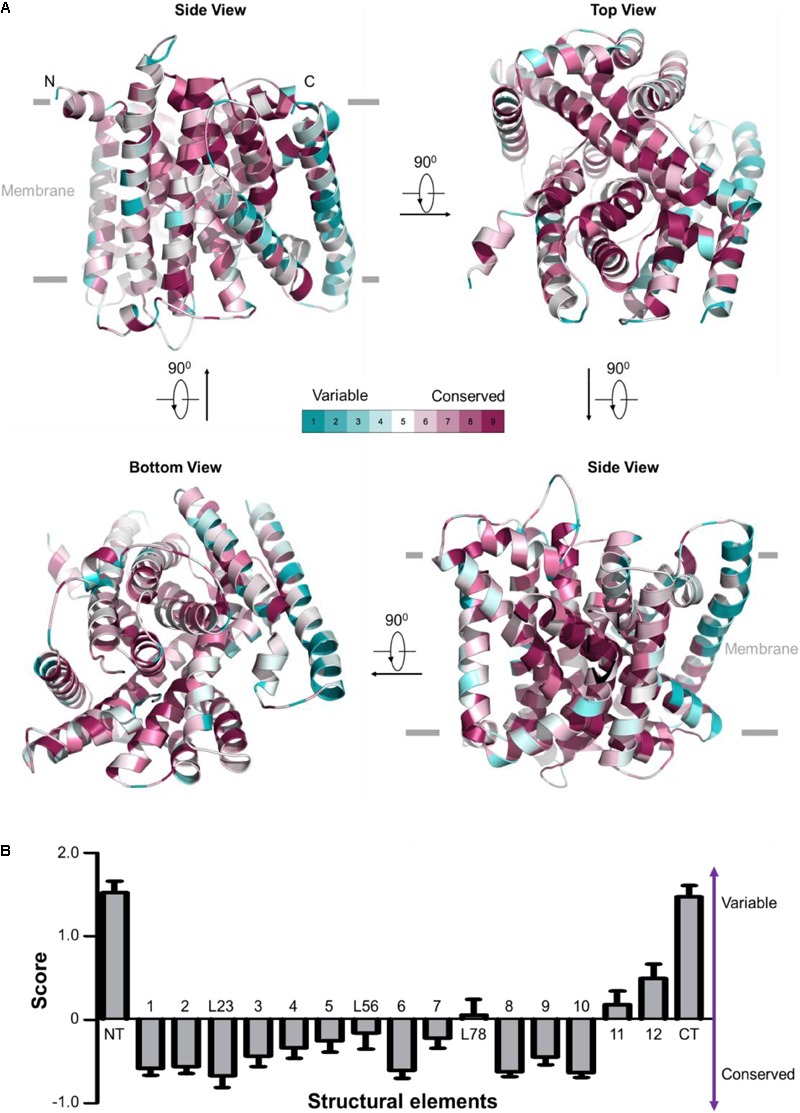
FIGURE 2.

Evolutionary conservation analysis for OsNrat1. The 25 plant Nramp family transporters were used to perform evolutionary conservation analysis by ConSurf. (A) Mapping of evolutionary conservation scales for amino acid positions in the core structure of OsNrat1 (45–502). Residues are colored by their conservation grades (1–9) using the color-coding bar, from turquoise to maroon indicating variable to conserved. The structure is shown in four orientations in cartoon representation. (B) Normalized evolutionary conservation score for each structural element of OsNrat1. The lowest score indicates that this position is the most conserved in this specific protein calculated using a specific multiple sequence alignment (MSA). Error bars represent SEMs. The NT and CT regions of OsNrat1 are not shown in (A).
