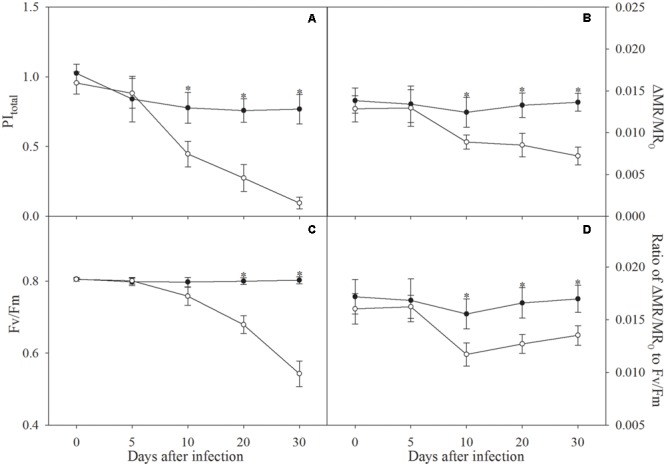
FIGURE 1.

Total performance index (PItotal, A), the maximal photochemical efficiency of PSI (ΔMR/MR0, B), the maximal photochemical efficiency of PSII (Fv/Fm, C), and ratio of ΔMR/MR0 to Fv/Fm (D) in control plants (closed symbols) and plants infected by Fusarium solani (open symbols). Data in the figure indicate the mean of five replicates (±SD), and asterisk indicates significant difference at P < 0.05.
