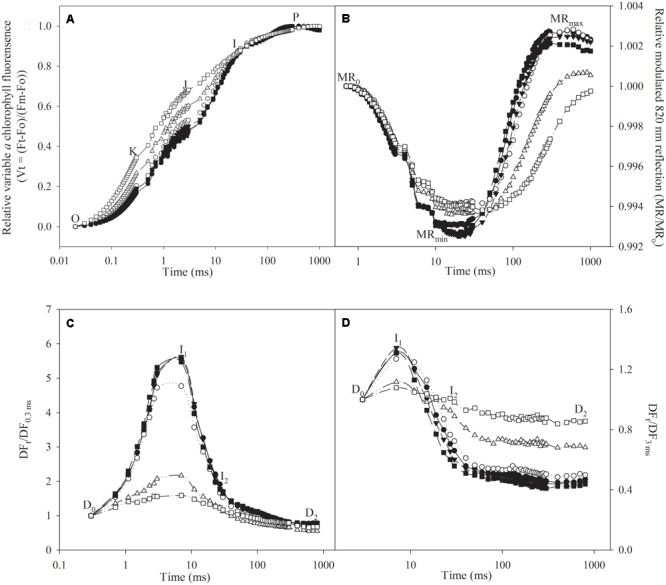
FIGURE 2.

Transients of prompt chlorophyll a fluorescence (A), modulated 820 nm reflection (B), and delayed chlorophyll a fluorescence in microsecond domain (C), and sub-millisecond domain (D) in control plants (closed symbols) and plants infected by Fusarium solani (open symbols) for 10 days (circles), 20 days (triangles), and 30 days (squares). O, K, J, I, and P indicate the specific steps in chlorophyll a fluorescence transient. MR0 is the value of modulated 820 nm reflection at the onset of red light illumination (0.7 ms, the first reliable MR measurement). MRmin and MRmax indicate the maximal point during PSI oxidation and the maximal point during PSI re-reduction, respectively. D0, I1, I2, and D2 indicate initial point, the first (7 ms) and second (50 ms) maximal peaks and minimum point in delayed chlorophyll a fluorescence curves. DF0.3 ms is the initial microsecond delayed fluorescence signal at 0.3 ms, and DF3 ms is the initial sub-millisecond delayed fluorescence signal at 3 ms. The signals were plotted on a logarithmic time scale. Each curve is the average of five replicates.
