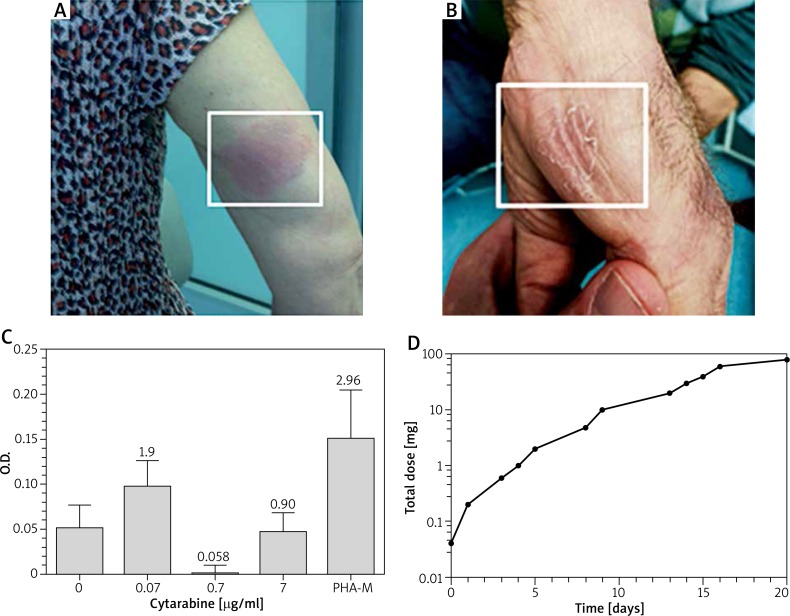
Figure 1.
A, B – Representative pictures of cutaneous lesions for case 1 and case 2. Similar lesions were scattered on the whole body. As for case 1, the lesion shown does not correspond to the site of injection of cytarabine. C – Case 2. Lymphocyte proliferation assessed after 5 days of culture with the indicated concentrations of cytarabine or phytohemagglutinin M (PHA-M). The ratio between the different cytarabine concentrations and negative control is shown above each Histogramm column. Error bars correspond to SEM. D – A dose-time desensitization curve of cytarabine

