
FIGURE 3.
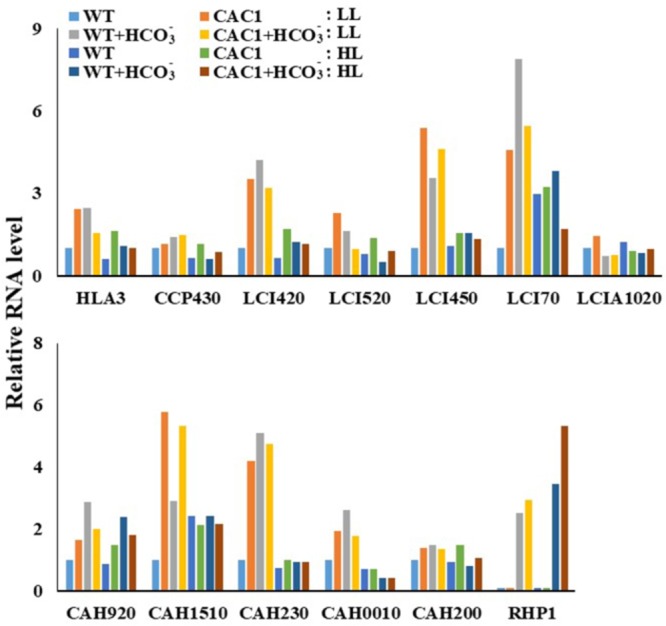
Transcript levels of CCM genes in WT and CAC1-mutant grown under photosynthesis limiting LL (50–80 μmol m-2 s-1) and saturating, HL (650–800 μmol m-2 s-1) intensities for 3 days. The Northern blot and RT-PCR bands were quantified from Supplementary Figure S2 and shown as relative abundance normalized to the WT expression level, which is considered as 1.0.