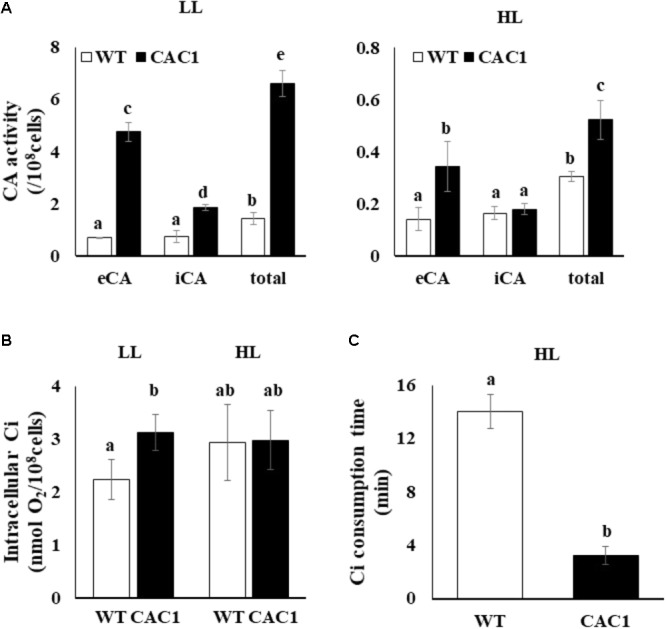
FIGURE 4.

Carbonic anhydrase (CA) activity (A), intracellular inorganic C (Ci) content (B), and intracellular Ci consumption time (C) in WT and CAC1 mutant grown under photosynthesis limiting LL (50–80 μmol m-2 s-1) and saturating, HL (650–800 μmol m-2 s-1) intensities for 3 days. eCA, extracellular CA activity; iCA, intracellular CA activity; total, eCA activity + iCA activity; data are means ± SE (n = 3). Means denoted by different letters indicated significant difference at p < 0.01 according to Tukey’s test.
