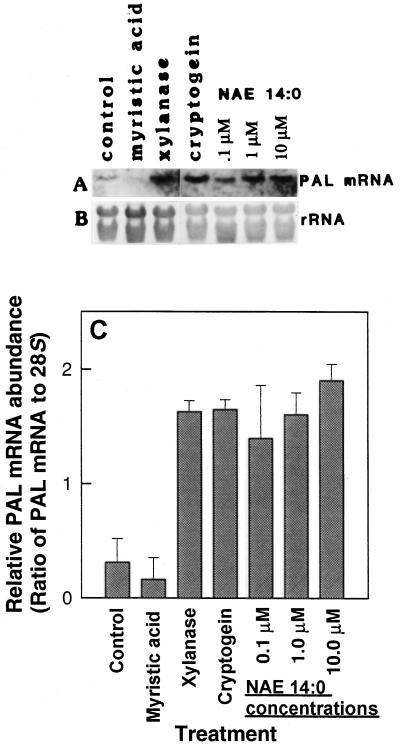
Figure 7.
Analysis of PAL mRNA expression in total RNA samples extracted from tobacco leaves treated with various amounts of NAE 14:0. Xylanase and cryptogein were included as positive controls. NAE 14:0 concentrations were varied from 0.1 to 10 μm and myristic acid, a 14:0 fatty acid, was tested at 100 μm. A, Northern blot showing PAL mRNA expression. B, Methylene blue-stained blot showing relative amounts of total RNA in each lane. C, Relative abundance of PAL mRNA (normalized to 28S rRNA by densitometric scanning and imaging analysis with NIH Image 3.1 software). Values represent the means ± sd of three independent experiments/extractions analyzed under identical conditions.

