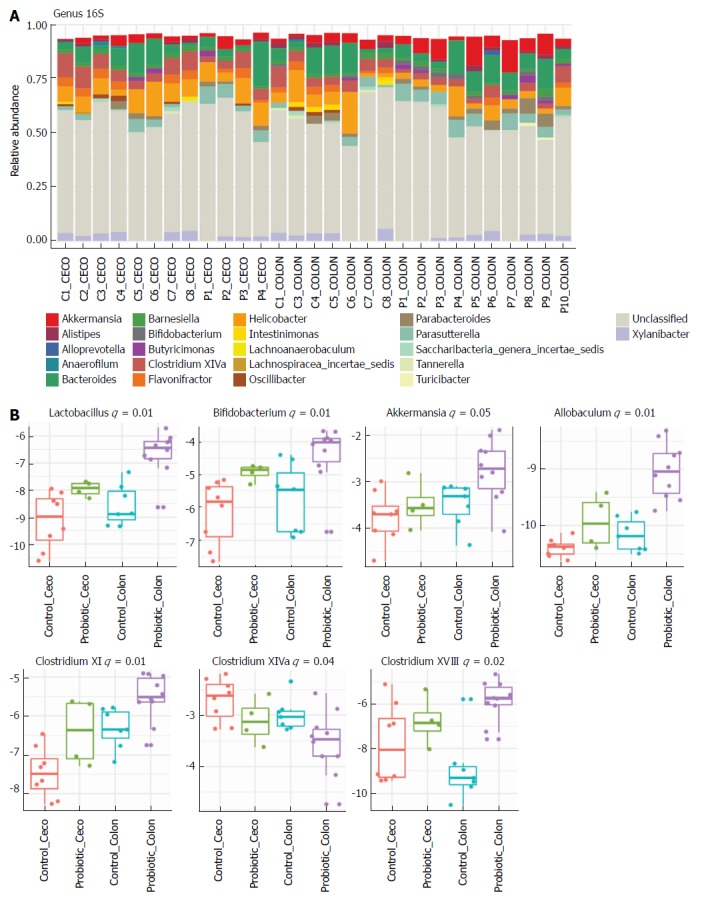
Figure 3.

Probiotic supplementation changes the gut microbiota in the colon at the genus level. Relative abundance at the genus level in the cecum and colon from control and probiotic-treated groups at day 60 after colon cancer induction. A: Each bar represents an individual animal, and the colour of each cell indicates the relative abundance of the bacterial genus. Taxa with relative abundance greater than 1% are shown. ‘C’ for Control and ‘P’ for Probiotic. B: Box-plot represents log relative normalized abundance at the genus level in the cecum and colon from control and probiotic-treated groups. Only significant P values (q value) obtained by the Kruskal-Wallis test are shown. Control cecum, n = 8; Probiotic cecum, n = 4; Control Colon, n = 7; Probiotic colon, n = 10. Kruskal-Wallis test.
