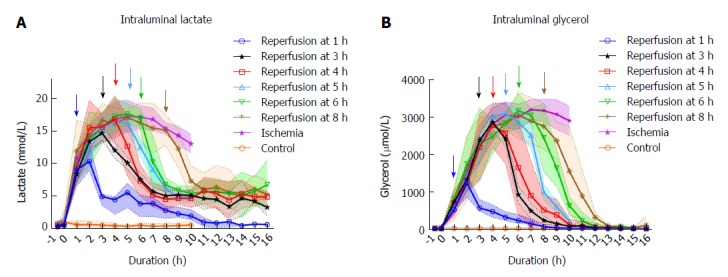
Figure 2.

Intraluminal microdialysis in pig jejunum. A: Plots show intraluminal lactate median with 95%CI bands of the median. B: Plots show intraluminal glycerol median with 95%CI bands of the median. Both: Measurements starts with a baseline 30 min before the initiation of ischemia at t = 0. Colored arrows show time points for start of reperfusion. Ischemia and reperfusion at 1, 3 and 5 h n = 14. Reperfusion at 4, 6 and 8 h n = 4. Control n = 5.
