. 2015 Jun 30;6(10):5586–5594. doi: 10.1039/c5sc01472g

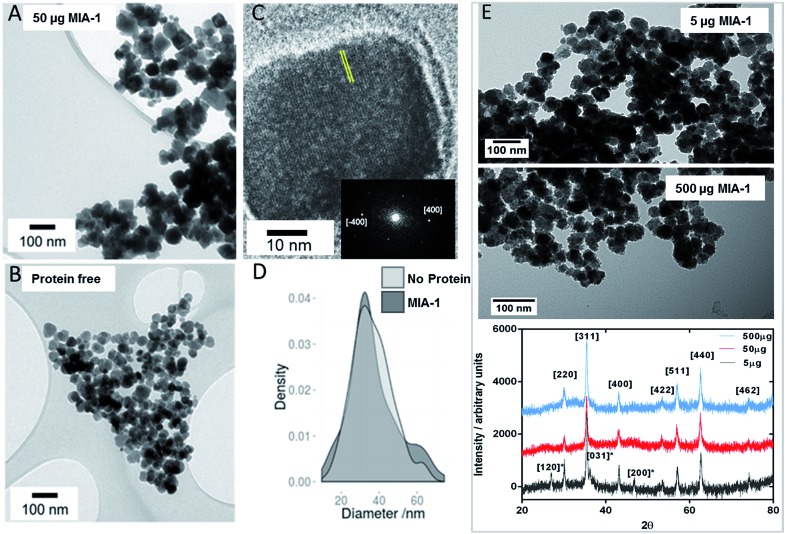
Fig. 7. Transmission Electron Microscopy analysis of magnetite nanoparticles. (A) Particles prepared with MIA-1 at 50 μg per 10 ml reaction. (B) Particles prepared in the absence of MIA-1. (C) HRTEM analysis of a representative MIA-1 prepared MNP. A region of the lattice fringe is highlighted with yellow lines and the Fourier transform is shown inset with the [400] peaks identified. (D) Particle size analysis of MNP prepared with and without addition of MIA-1. (E) Transmission Electron Microscopy and X-ray diffraction analysis of magnetite nanoparticles at varying amounts of MIA-1. Powder XRD analysis of particles produced at 5 μg (grey), 50 μg (red) and 500 μg (blue) of MIA-1. Principal magnetite peaks have been assigned. Peaks present in the 5 μg sample assigned to lepidocrosite are denoted with an asterisk.

Fig. 7