
Figure 3. Mean Adjusted Plasma Concentration-Time Profiles.
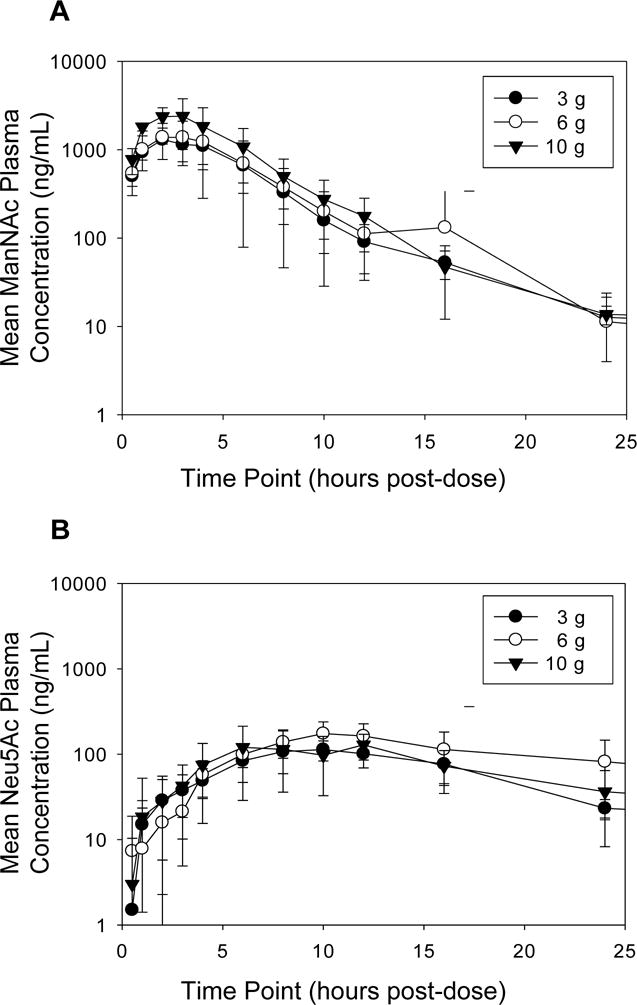
Mean (± SD) plasma concentrations of ManNAc (A) and Neu5Ac (B) after a single oral dose of ManNAc administered to fasted GNE myopathy subjects with baseline adjustment. Baseline adjustment was made by subtracting ManNAc or Neu5Ac concentration at time t=0 h for each subject.