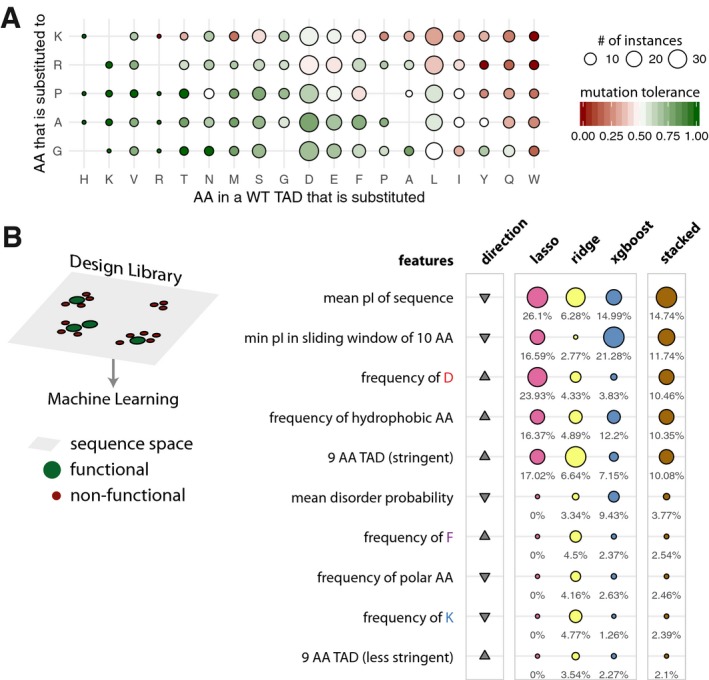
Figure 4. Mutational scanning of naturally occurring TADs and the top 10 features of the machine‐learning models trained on the design library.

- Heatmap of the tolerance to amino acid substitutions in WT transactivation domain sequences. The tolerance of a mutation is defined as the fraction of functional sequences over all the sequences when a specific substitution was performed. The columns (amino acid in a WT TAD that is substituted) are ordered according to decreasing tolerance (from left to right), and the rows (amino acid into which a residue in the WT TAD is substituted for) are ordered according to decreasing tolerance (from bottom to top). The cells are colored on a green to red gradient for high to low tolerance, respectively. Empty tiles represent data points not detected in the library.
- Schematic describing the sequence space explored by the design library (left). Table listing the top 10 most important features. The relative feature importance is given as relative percentages in the last four columns. The size of the circles is scaled per method (lasso, ridge, xgboost, stacked). The direction column denotes the direction of enrichment of the given feature for functional sequences compared to non‐functional sequences (up, positive direction and down, negative direction). This figure provides a simplified description of the actual features, which are available in Table EV7.
