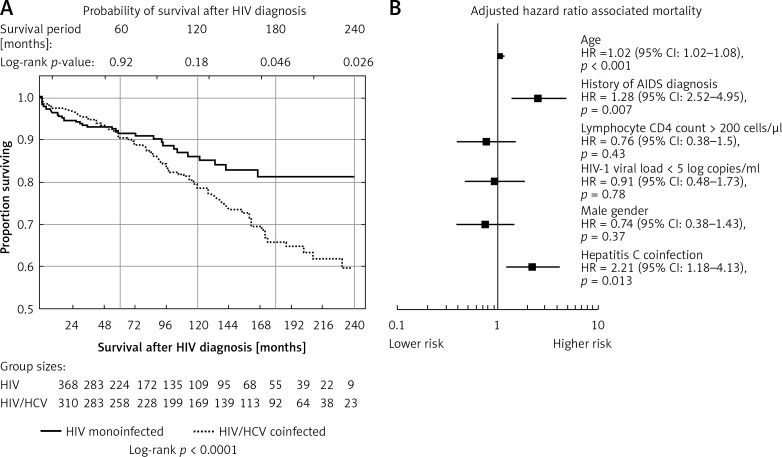
Figure 2.
A – Kaplan-Meier plots indicating probability of survival after HIV diagnosis among HIV monoinfected and HIV/HCV coinfected patients. B – Multivariate Cox regression plots presenting adjusted hazard ratios associated with mortality at the time point of 20 years follow-up with HIV. Squares represent adjusted hazard ratio (HR) for the parameters, lines represent confidence intervals for the HR

