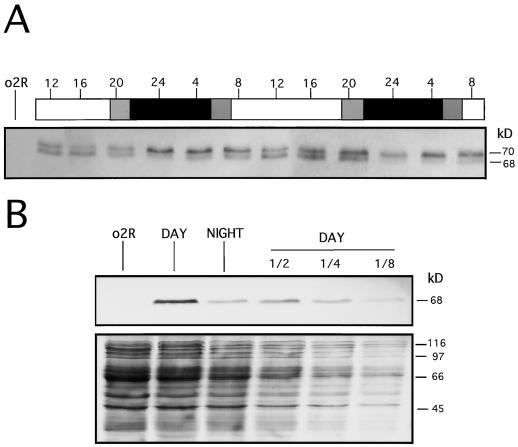
Figure 2.
Results of western analysis showing diurnal changes in O2 phosphorylation (A) and accumulation (B). A, Wild-type kernels (from 11–13 DAP) were harvested as indicated in Figure 1. Total protein extracts were made from endosperm tissue, and 20 μg from each sample were electrophoresed into a 10% (w/v) SDS-PAGE gel, blotted, and immunodetected using a polyclonal anti-O2 antiserum. Apparent sizes are indicated at right in kD. The 70-kD band contains the inactive DNA-binding isoforms (hyperphosphorylated forms), whereas the 68-kD band includes the active DNA-binding isoforms (unphophosphorylated and hypophosphorylated forms). White and black bars indicate light and dark periods, respectively. Gray bars indicate dawn and dusk. The time at which endosperm samples were collected is indicated on the top of the bars as a 24-h clock. Lane o2R is as indicated in Figure 1. B, Total protein extracts were prepared from o2R (15 DAP) and wild-type kernels (15 DAP) harvested at midday (DAY) or at midnight (NIGHT). After separation by 15% (w/v) SDS-PAGE gel and electroblotting, the O2 protein was visualized using a polyclonal anti-O2 antiserum (upper panel). Approximately equal amounts of total protein extract (40 μg) from o2R, DAY, and NIGHT samples were loaded adjacent to a serial dilution (1/2, 1/4, and 1/8) of the DAY sample. The staining of the membrane used for the immunodetection with Ponceau S serves as loading control (lower panel).

