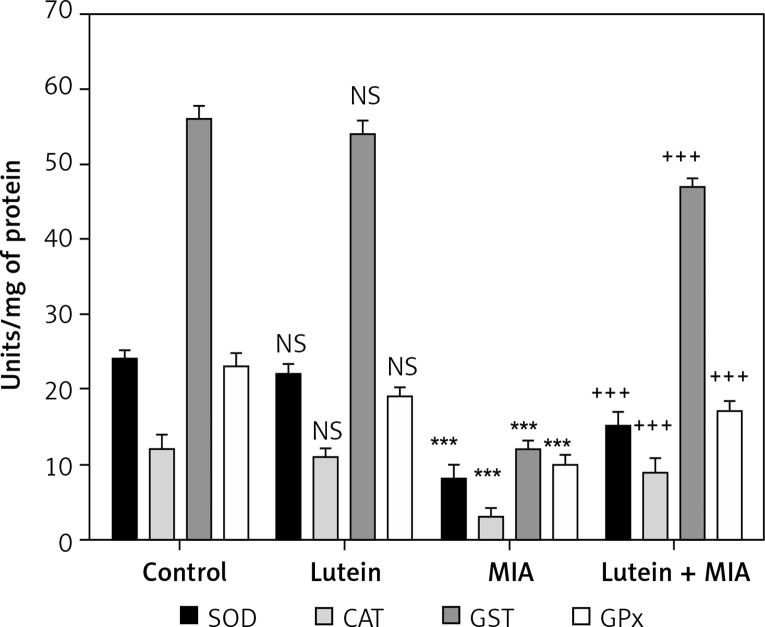
Figure 4.
Lutein enhances antioxidant enzyme activities. Results are given as the mean ± SEM. SOD, CAT, GST and GPx expressed in units/mg protein. ***p < 0.001 when compared to control group. +++p < 0.001 when compared to MIA treatment. NS–non-significant compared to control group (One-way ANOVA followed by Tukey’s multiple comparison)

