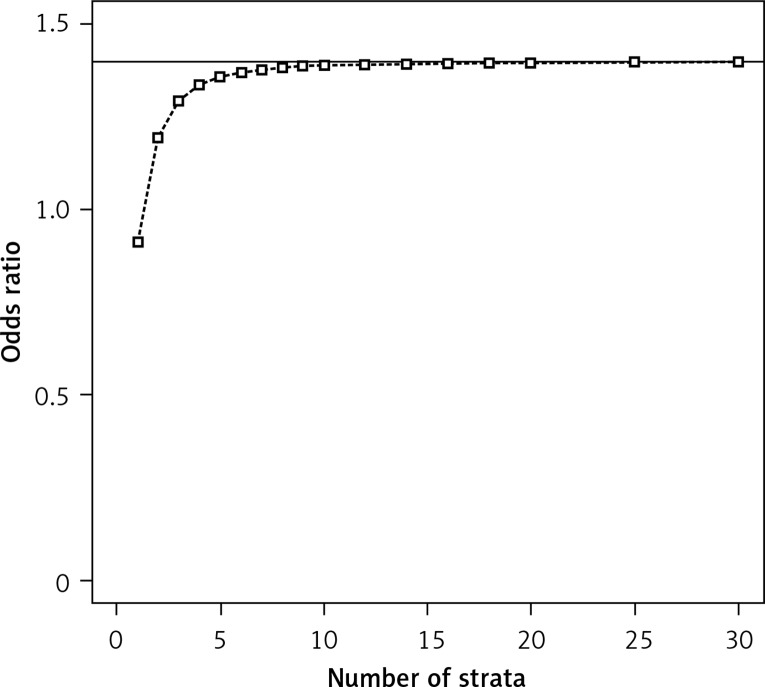
Figure 1.
Mean of the estimated odds ratios (simulated using conditional logistic regression with stratification based on propensity scores, sample size per group = 1000, distributions of the propensity score (PS): beta(4,2) in group 1 and beta(7,1) in group 2, binomial proportions for success: 0.18 + PS/2 in group 1 and 0.1+PS/2 in group 2); the true odds ratio is 1.4 (indicated with the horizontal line)

