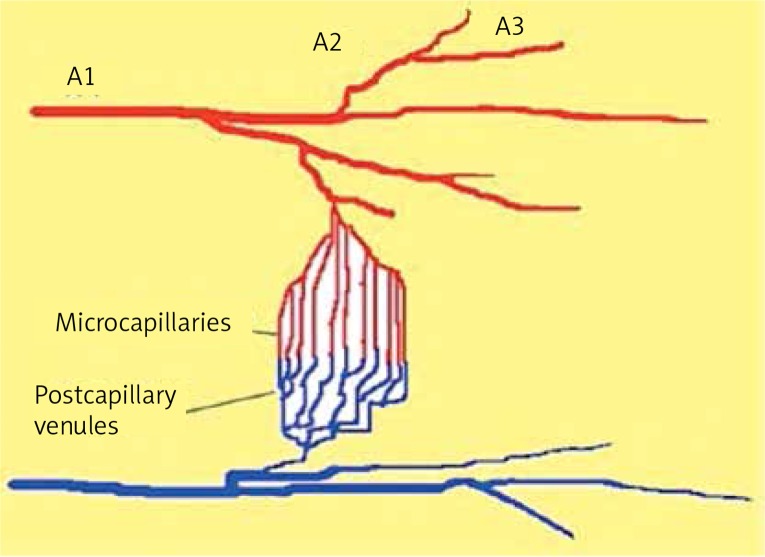
Figure 4.
Diagram showing the areas of cremaster muscle microcirculation which were analysed in the experimental study. A1, A2, A3 arterioles – vessel diameters, and red blood cell velocity of the arterioles were measured; capillaries – the number of perfused capillary vessels were studied in the power field of view (FCP); post-capillary venule-neutrophil-endothelial interactions and vascular permeability (PI) were measured (description in text)

