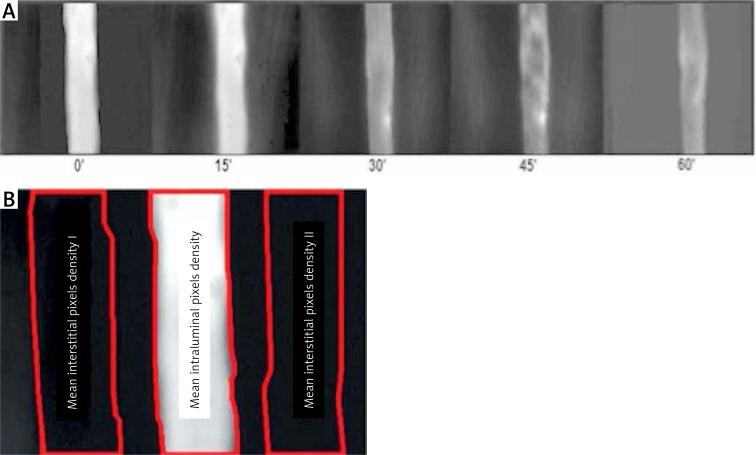
Figure 8.
A – Fluorescence microscopy. FITC-albumin molecules are visible in the post‑capillary vessel lumen as the white column. Transition of FITC-labelled albumin from the lumen into the extravascular space is visible as white streaks on both sides of the post‑capillary venule lumen. Images were taken at 15-minute intervals at the 5th h of the experiment. 0’ – photo taken immediately after injection of FITC-albumin, 15’, 30’, 60’ – pictures taken respectively at 15, 30, 45, and 60 min after injection of FITC-labelled albumin. B – Images of post‑capillary venules collected during the fluorescence microscopy were analysed using Image Pro-Plus software. The area of bright vessel’s part was outlined and then analysed as the intravascular space (IVS). On both sides of the post‑capillary venule similar in size and shaped areas of the extravascular space (ISS) were outlined. Average optical density of the analysed areas was calculated, and then the ISS to IVS ratio was calculated as the endothelial permeability index (PI)

