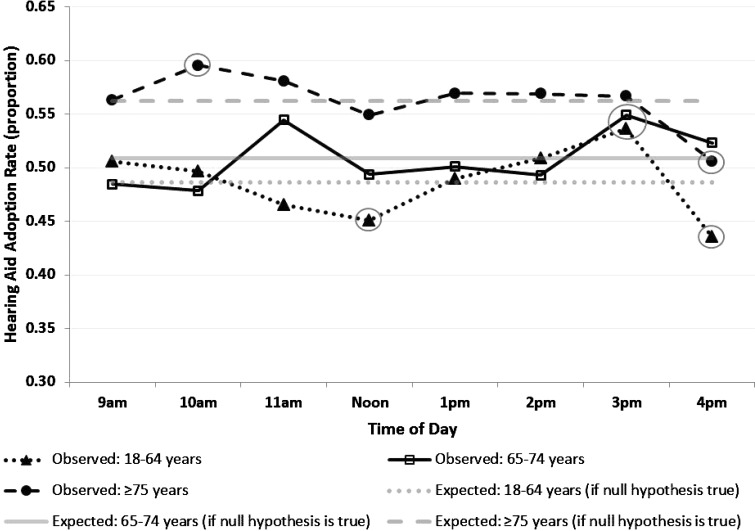
Figure 4.
Mean observed (black lines) and expected (gray lines) hearing aid adoption rates for the group of participants ages 18 to 64 years (dotted lines), 65 to 74 years (solid lines), and ≥ 75 years (dashed lines) depicted by the time of day. Circles highlight data points where there are significant differences between observed and corresponding expected performance.

