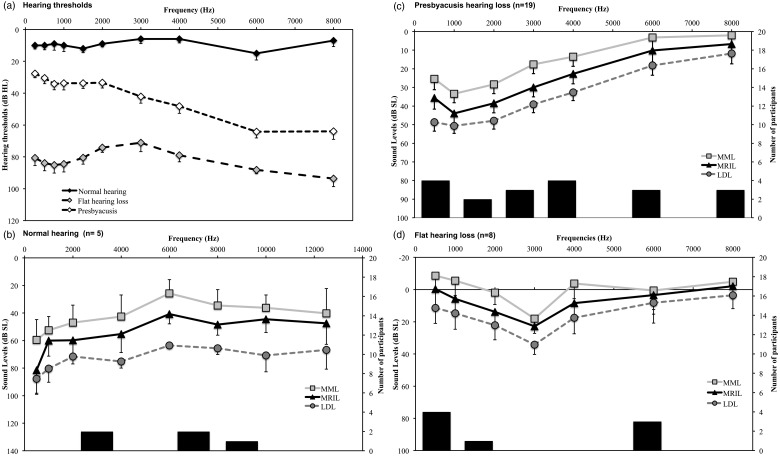
Figure 4.
Results obtained at the Lyon site. Data were divided as a function of the audiogram shape. (a) Audiometric thresholds of the three groups. The MML, MRIL, and LDL expressed in dB SL are presented for each group separately, (b) normal audiograms group, (c) presbycusis-type audiograms, and (d) flat hearing loss. The secondary axis bar chart represents the distribution of predominant tinnitus frequency for each group. The error bars represent the standard error of the mean.
MML = minimum masking level; MRIL = minimum residual inhibition level; LDL = loudness discomfort level.

