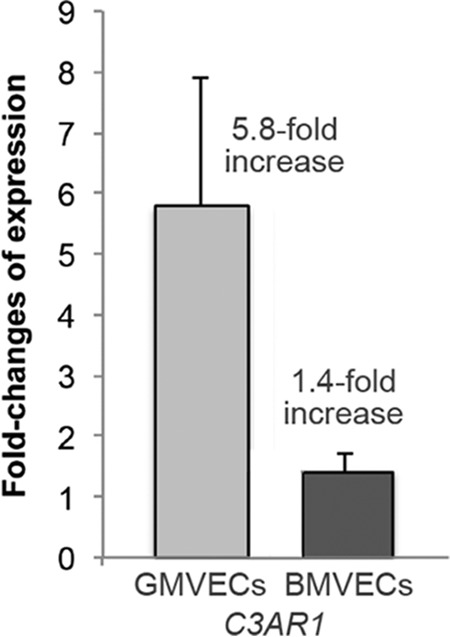
Figure 8.

Quantitative gene expression of C3AR1 in TNF-stimulated BMVECs and GMVECs. The fold-changes in mRNA levels in BMVECs and GMVECs after TNF stimulation were measured by RT-qPCR for the C3a receptor gene C3AR1. RNA was extracted in 4–6 separate experiments from unstimulated BMVECs and GMVECs that were maintained in serum-free medium for 24 h and in cells stimulated with 10 ng/ml TNF for 48 h (24 h in complete medium and 24 h in serum-free medium). Changes in gene expression in GMVECs and BMVECs in the presence of TNF were calculated using the method developed by Pfaffl et al. (78). Data are means plus standard deviations from 3 to 5 real-time qPCR runs with triplicate measurements. GAPDH was used for normalization.
