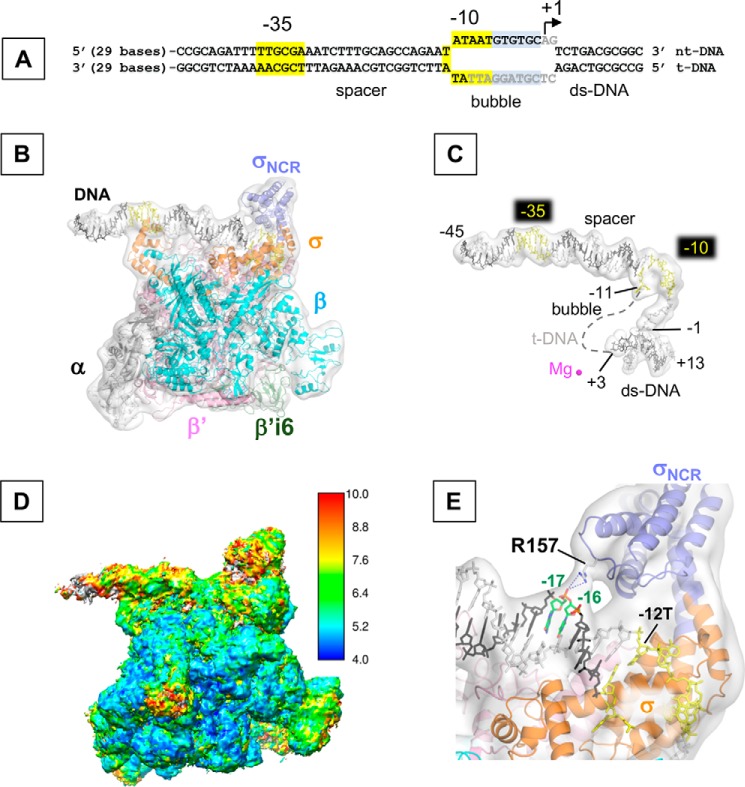
Figure 1.
The cryo-EM structure of the E. coli RPo. A, sequence of the promoter DNA visible in the cryo-EM structure of RPo (from −45 to +13) is depicted (full-length DNA sequence used for the RPo preparation is shown in Fig. S2). −35 and −10 elements (highlighted in yellow), transcription bubble, and transcription start site (+1) are indicated. Bases shown in gray are disordered in the RPo structures. B, cryo-EM structure of RPo. Ribbon model of RNAP and stick model of DNA are superimposed with the cryo-EM density map (white and transparent). Each subunit of RNAP, the σNCR (light blue) and β′i6 (green) are indicated in color. Template (t-DNA) and non-template DNA strands (nt-DNA) are depicted as dark gray and light gray, respectively and the −35 and −10 elements are shown in yellow. C, promoter DNA in the RPo. Stick model of promoter DNA with its cryo-EM density map are shown as the same orientation as in B. Dashed line represents the disordered t-DNA in the transcription bubble. The active site Mg2+ ion is shown as magenta sphere. Nucleotide bases at −11 and +3 (representing boundaries of the transcription bubble) and transcription start site (+1) are indicated. D, cryo-EM map of RPo colored by local resolution oriented as the same orientation as in B. E, a zoomed-in view of B shows the interaction between Arg-157 residue and t-DNA at −16/−17 positions. RNAP and DNA models are superimposed with the cryo-EM density map (white and transparent).

