
Figure 7.
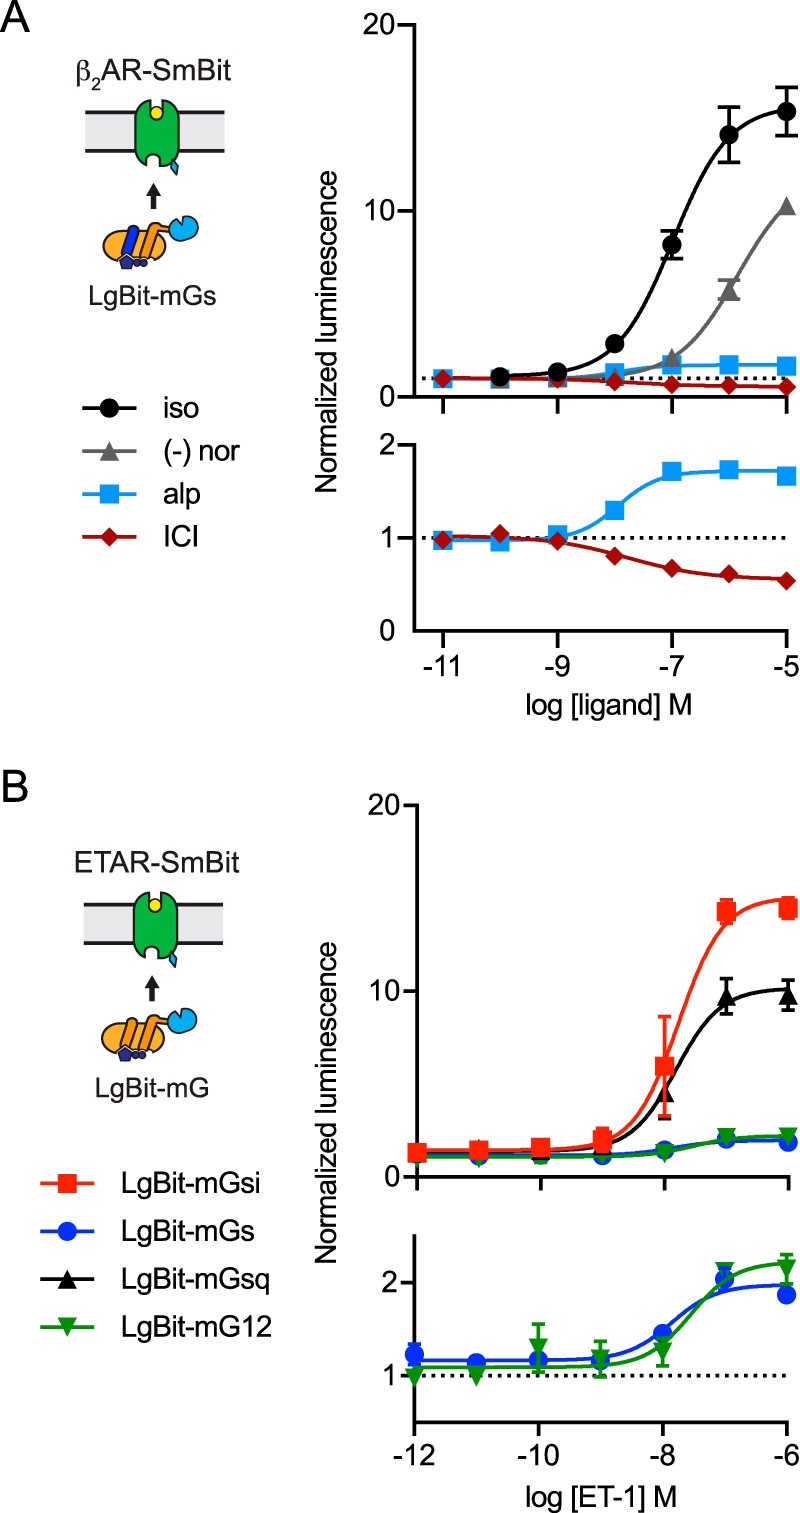
Split luciferase complementation driven by mGs. A, total luminescence (normalized) emitted by cells cotransfected with β2AR-SmBit and LgBit-mGs is plotted versus ligand concentration for isoproterenol (iso), (−)-norepinephrine (nor), alprenolol (alp), and ICI 118,551 (ICI); mean ± S.E. of 4–13 independent experiments. B, total luminescence (normalized) emitted by cells cotransfected with ETAR–SmBit and four different LgBit–mG proteins is plotted versus the concentration of endothelin-1 (ET-1); mean ± S.D. of four independent experiments.