Figure 4.

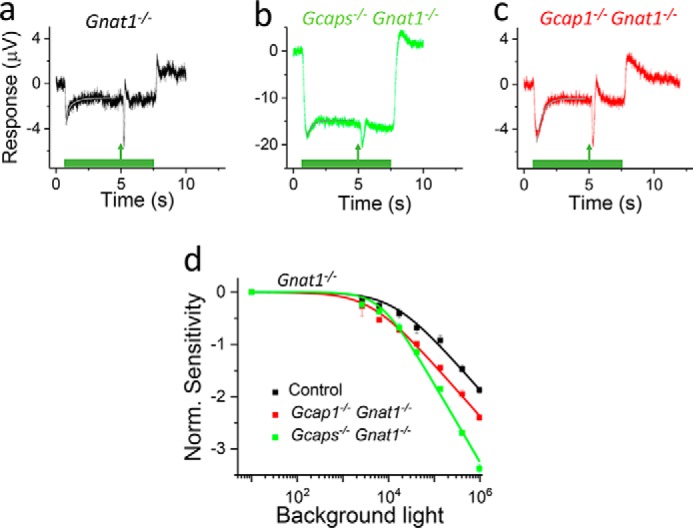
GCAP1 and GCAP2 contribute to the light adaptation capacity of cones. a–c, responses of cones to 7-s steps of light with a 1-ms flash delivered 4.5 s after the step onset from isolated retinas of control Gnat1−/− (a), Gcaps−/− Gnat1−/− (b), and Gcap1−/− Gnat1−/− (c) mice obtained using ex vivo ERG recordings. Smooth gray traces plot Equation 3 with best fitting parameters A1, τ1, and τ2. See “Results” for numerical values and statistical analysis. d, sensitivity (SF) normalized (Norm.) with the dark-adapted sensitivity (SF,D) of cones as a function of background light intensity (I) in control Gnat1−/− (black), Gcaps−/− Gnat1−/− (green), and Gcap1−/− Gnat1−/− (red). Smooth lines plot Equation 2 with I0 of 13,500 photons μm−2 s−1 (n = 1), 6,700 photons μm−2 s−1 (n = 1.4), and 4,100 photons μm−2 s−1 (n = 1) for control Gnat1−/− (black), Gcaps−/− Gnat1−/− (green), and Gcap1−/− Gnat1−/− (red). n = 3 mice (four retinas) for each genotype. Error bars give S.E.
