Figure 4.

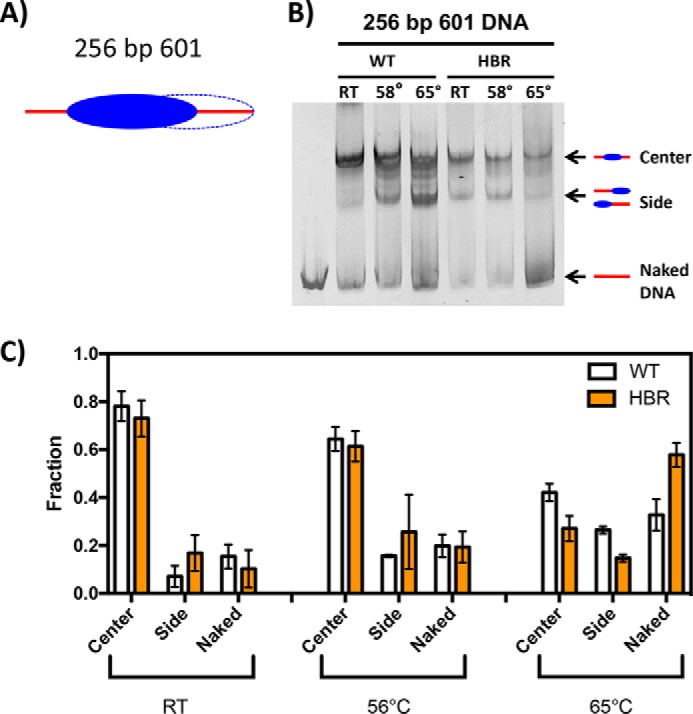
Thermal repositioning of WT and ΔHBR NCPs. A, schematic diagram of NCPs reconstituted with the 256-bp 601 DNA positioning sequence. Strongest NCP positions are indicated by solid ellipses, and weaker positions are indicated by dashed lines. B, representative 5% nondenaturing polyacrylamide gels of WT and ΔHBR NCPs reconstituted with the 256-bp 601 DNA positioning sequence. C, quantification of the fraction of DNA in each NCP structure (center or side) or as naked DNA at different temperatures. Error bars represent ± S.D. of the mean of at least three independent experiments.
