Figure 3.
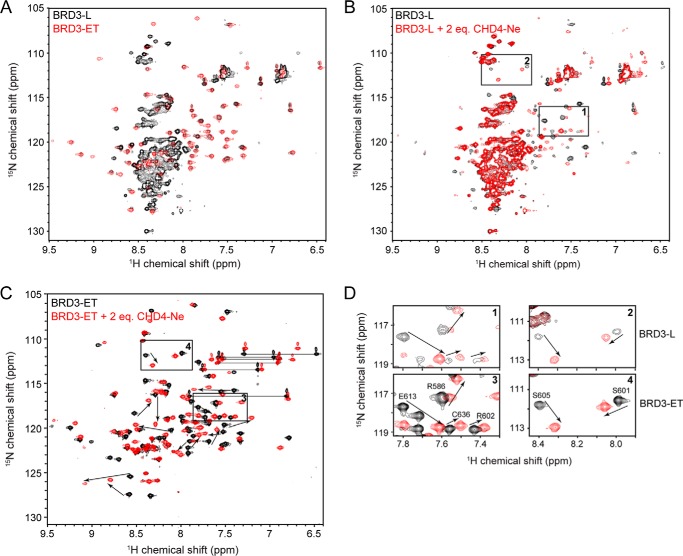
BRD3-ET binds CHD4(265–310). 15N HSQC spectra were acquired in 20 mm sodium phosphate, pH 6.5, 50 mm NaCl, 1 mm DTT at 298 K. A, 15N HSQC spectra of BRD3-L (black) and BRD3-ET (red). Most of BRD3-L outside of the core ET domain appears to be disordered. B, titration of 15N-BRD3-L with CHD4-Ne. Arrows indicate large chemical shift changes induced by CHD4-Ne. Boxed regions are shown in detail in D. C, 15N HSQC spectra of 15N-BRD3-ET alone and in the presence of 2 m eq of CHD4-Ne. Boxed regions are shown in detail in D. D, comparison of CHD4-induced peak movements in BRD3-L and BRD3-ET, showing that BRD3-ET and BRD-L bind CHD4 in a comparable manner.

