Figure 7.
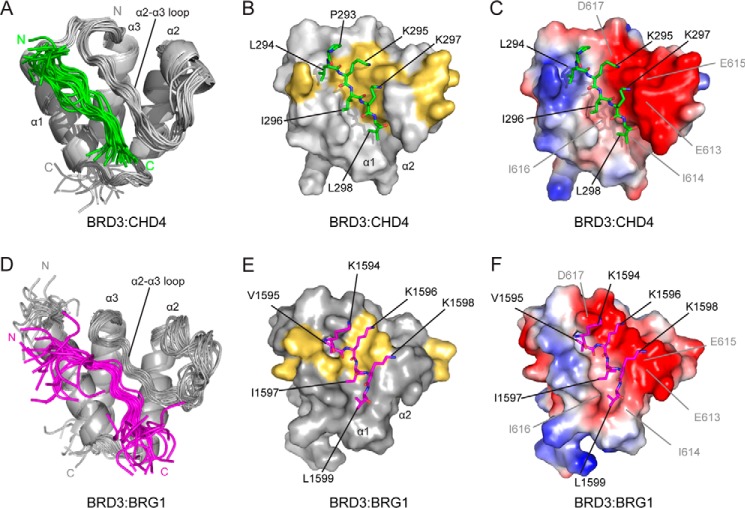
Solution NMR structure of the BRD3-ET–CHD4 and BRD3-ET–BRG1 complexes. A, ribbon representation of the ensemble of 20 lowest energy structures for the BRD3-ET–CHD4-Ng complex. N and C termini are labeled. B, surface representation of BRD3-ET with CHD4-Ng shown as sticks. Only ordered CHD4 residues are shown and labeled. BRD3 residues with CHD4-induced chemical shift changes of >1 standard deviation above the mean are indicated in yellow. C, surface representation showing the electrostatic properties of the binding pocket. BRD3-ET residues are labeled. The electrostatic complementarity is clear. D–F, representations of the BRD3-ET·BRG1 structure, as for A–C. BRG1 is shown in magenta.

