Figure 9.

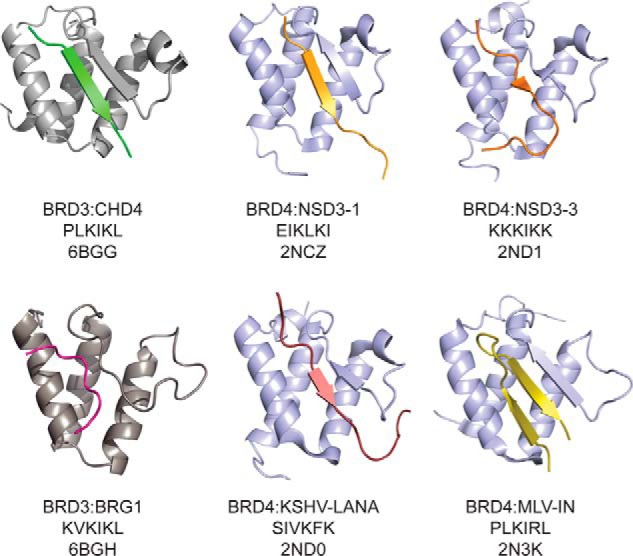
Comparison of structures of ET domain complexes. ET-binding peptides, as well as the ET domain of BRD3 (gray) or Brd4 (blue), are shown as ribbons. The BET protein, core peptide sequence, and PDB code are indicated below the structures.

Comparison of structures of ET domain complexes. ET-binding peptides, as well as the ET domain of BRD3 (gray) or Brd4 (blue), are shown as ribbons. The BET protein, core peptide sequence, and PDB code are indicated below the structures.