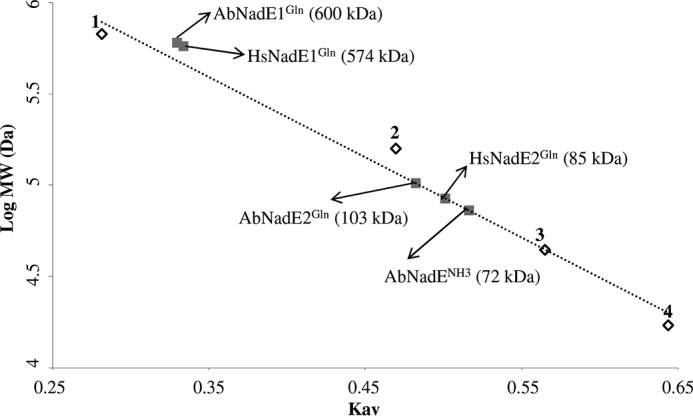
Figure 2.

Gel filtration analysis of the different NadE. Gel filtration was performed on a Superose 6 column (GE Healthcare), which was calibrated with a range of molecular mass standards (Bio-Rad): point 1, thyroglobulin; point 2, bovine γ-globulin; point 3, chicken ovalbumin; and point 4, equine myoglobin. The arrows indicate the estimated molecular weight of each NadE protein.
