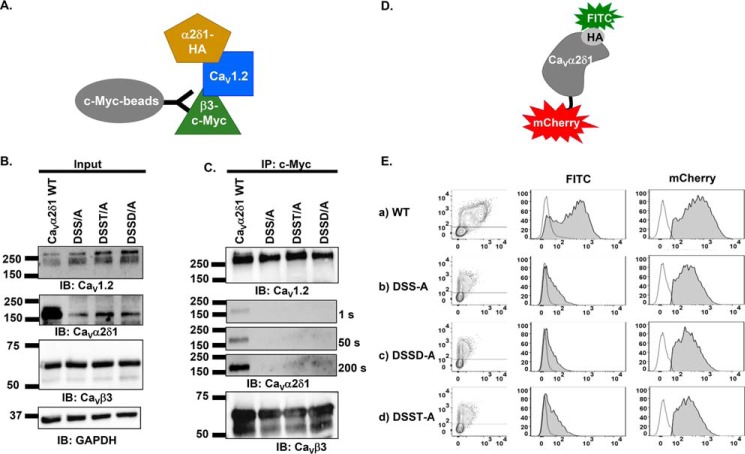
Figure 2.
Multiple mutations of MIDAS residues abolish the coimmunoprecipitation of CaV1.2 with CaVα2δ1. A, schematic demonstrating the coimmunoprecipitation assay using CaVβ3–c-Myc as the bait. B, HEKT cells were transiently transfected with pCMV-CaV1.2, pCMV-CaVβ3–c-Myc, and pmCherry-CaVα2δ1-HA WT or mutants as shown. Cell lysates were immunoprecipitated (IP) overnight with anti-c-Myc magnetic beads to capture CaVβ3, eluted in a Laemmli buffer and fractionated by SDS-PAGE using 8% gels. B, immunoblotting (IB) was carried out on total proteins (20 μg) before coimmunoprecipitation assay (input lane) to confirm that all proteins have been correctly translated. Constructs are from left to right: mCherry-CaVα2δ1-HA WT; mCherry-CaVα2δ1-HA DSS/A (D259A/S261A/S263A); mCherry-CaVα2δ1-HA DSST/A (D259A/S261A/S263A/T331A); and mCherry-CaVα2δ1-HA DSSD/A (D259A/S261A/S263A/D363A). The signal for the housekeeping protein GAPDH is shown. C, immunoblotting was carried out after eluting the protein complexes (IP–c-Myc lane) from the beads with anti-CaV1.2, anti-CaVα2δ1, and anti-CaVβ3 antibodies (from top to bottom, as indicated). All immunoblots were carried out in parallel under the same transfection and extraction conditions. The signal for CaVα2δ1 was revealed after three exposures times (1, 50, and 200 s). CaVβ3 and CaV1.2 proteins migrated, respectively, at 60 and 250 kDa. All CaVα2δ1 proteins migrated at ≈175 kDa, which is consistent with the molecular mass of the mCherry-CaVα2δ1-HA WT reported in previous studies (19). These assays were repeated three times over the course of 6 months with different cell preparations. Assays carried out with anti-HA–coated beads to pull down the channel complex with CaVα2δ1-HA as the bait (as seen in Fig. 6) yielded similar results. D, schematic illustrating the relative position of the extracellular HA epitope and the intracellular mCherry translated after the C terminus on the mCherry-CaVα2δ1-HA construct used to carry the flow cytometry assays. The construct allows for detection of intracellular and extracellular fluorescence using, respectively, a FITC-conjugated anti-HA and the constitutive fluorescence of mCherry. E, representative two-dimensional plots of mCherry versus FITC fluorescence. The cell-surface expression of the mCherry-CaVα2δ1-HA construct WT and mutants from the surface fluorescence emitted by the FITC-conjugated anti-HA as measured using a flow cytometry assay (10,000 intact cells) is shown. From top to bottom, the constructs that were tested are as follows: (a) mCherry-CaVα2δ1-HA WT; (b) mCherry-CaVα2δ1-HA DSS/A (D259A/S261A/S263A); (c) mCherry-CaVα2δ1-HA DSSD/A (D259A/S261A/S263A/D363A); and (d) mCherry-CaVα2δ1-HA DSST/A (D259A/S261A/S263A/T3331A). Left panel: relative intensity of the fluorescence signal produced by the FITC-conjugated anti-HA (x axis) and produced by the mCherry (y axis) yields an estimate of the cell surface and intracellular expression, respectively. The robust mCherry signal (y axis) confirms that the proteins were translated up to the end of the coding sequence, an observation also obtained from carrying out routine Western blotting. Middle panel: histogram of the relative fluorescence intensity for the FITC-conjugated anti-HA. Right panel: histogram of the relative fluorescence intensity for the constitutive mCherry signal. The cell-surface fluorescence for FITC, calculated as ΔMedFI, as explained under “Experimental procedures,” was significantly smaller for CaVα2δ1-HA mutants than for the WT construct (see Table 1 for numerical values). Furthermore, the mCherry signal, which reflects the total protein density, was also decreased suggesting that these mutations impaired protein stability.

