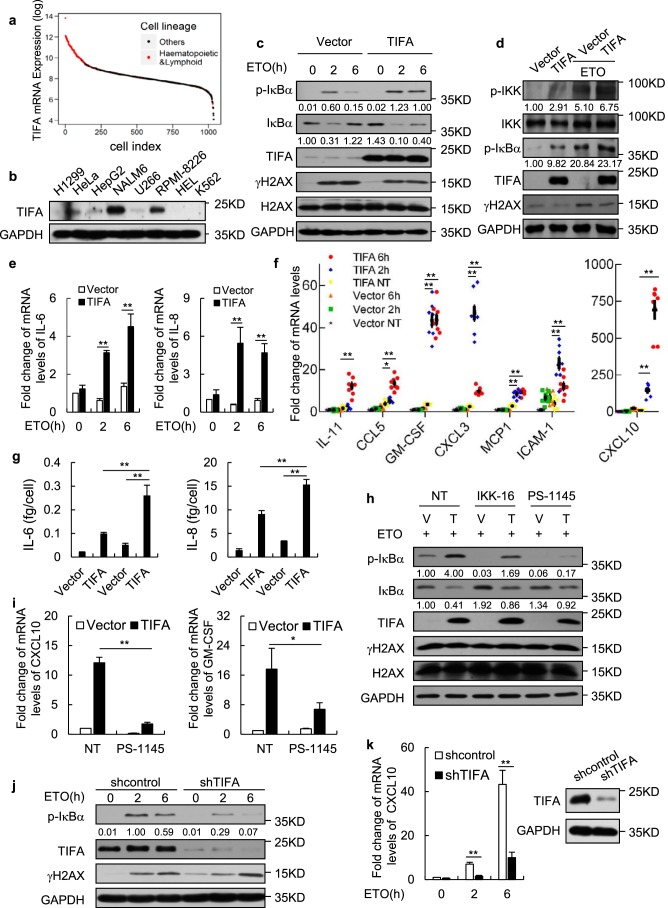
Figure 4.
TIFA potentiates DNA damage-induced NF-κB activation in myeloma cells. a, the dataset of TIFA mRNA expression levels across ∼1000 cell lines were retrieved from the Cancer Cell Line Encyclopedia (CCLE). The sorted data were log transformed and the hematopoietic or lymphoid cells were highlighted in red. b, whole cell lysates from the indicated cell lines were subjected to Western blot analysis with anti-TIFA antibody to assess its endogenous protein levels. c, time course measurement of protein levels in U266 cells infected with lentivirus expressing TIFA (pHBLV-TIFA) or control (pHBLV) and treated with ETO. d, the U266 cells infected with lentivirus expressing TIFA (pHBLV-TIFA) or control (pHBLV) were treated with ETO as indicated. The cell lysate was then harvested for Western blot analysis with the indicated antibodies. e, the U266 cells were infected with lentivirus expressing TIFA (pHBLV-TIFA) or control (pHBLV) and then treated with ETO for 2 or 6 h. The mRNA levels of the indicated genes were examined using quantitative RT-PCR analysis. Data were represented as the mean ± S.D. from three independent experiments. **, p < 0.01 (Student's t test). f, the U266 cells were infected with lentivirus expressing TIFA (pHBLV-TIFA) or control (pHBLV) and then treated with ETO for 2 or 6 h. The mRNA levels of the indicated genes were examined using quantitative RT-PCR analysis. Data were represented as the mean ± S.D. from eight independent experiments. *, p < 0.05; **, p < 0.01 (Student's t test). g, U266 cells infected with lentivirus expressing TIFA (pHBLV-TIFA) or control (pHBLV) were further treated with (last two) or without ETO (first two). The secretory levels of IL-6 and IL-8 were then measured by ELISA. Data were represented as the mean ± S.D. from three independent experiments. **, p < 0.01 (Student's t test). h and i, U266 cells infected with lentivirus expressing TIFA (pHBLV-TIFA) or control (pHBLV) were further treated with ETO and IKK inhibitors IKK-16 or PS-1145. The whole cell lysate and mRNA from cells described above were then prepared for Western blot analysis or quantitative RT-PCR analysis. Data of quantitative RT-PCR analysis were represented as the mean ± S.D. from three independent experiments. *, p < 0.05; **, p < 0.01 (Student's t test). j, RPMI-8226 cells infected with shRNA control or shRNA against TIFA using lentivirus were further treated with ETO for 2 or 6 h. Western blot analysis was then performed to examine the expression levels of indicated proteins. k, the total mRNA was prepared from cells described in j and the mRNA levels of the indicated gene was examined using quantitative RT-PCR analysis. Data were represented as the mean ± S.D. from three independent experiments. **, p < 0.01 (Student's t test). The right panel shows knockdown efficiency of TIFA protein. IL, interleukin.

