Figure 7.
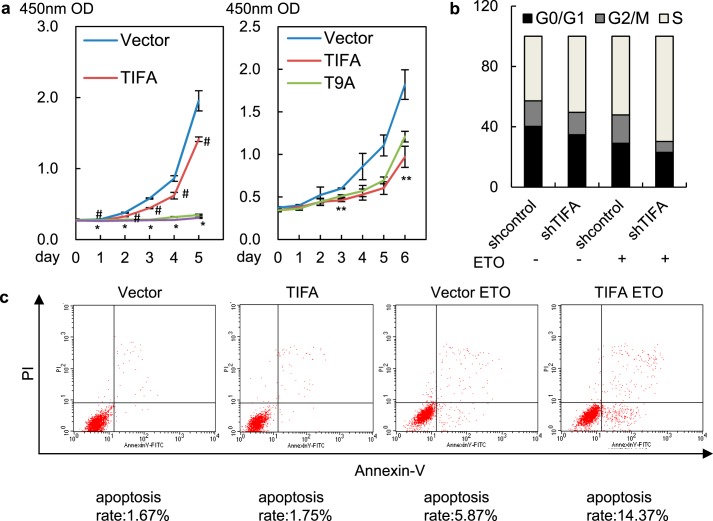
TIFA overexpression is correlated with decreased cancer cell proliferation. a, growth curves of U266 cells infected with lentivirus expressing TIFA (pHBLV-TIFA) or control (pHBLV) in the absence or presence of ETO were determined by CCK-8 (left). Growth curves of U266 cells infected with lentivirus expressing TIFA (pHBLV-TIFA), TIFA-T9A (pHBLV-TIFA-T9A), or control (pHBLV) in the presence of ETO were determined by CCK-8 (right). Data were represented as the mean ± S.D. from three independent experiments. #, p < 0.05, TIFA versus vector. *, p < 0.05, TIFA versus vector in the presence of ETO. **, p < 0.05, TIFA versus TIFA-T9A. b, the RPMI-8226 cells infected with lentivirus expressing shRNA control or shRNA against TIFA were further treated with vehicle or ETO. The flow cytometry was then used to evaluate the effect of TIFA on cell cycle progression. c, the U266 cells infected with lentivirus expressing TIFA (pHBLV-TIFA) or the control (pHBLV) were further treated with vehicle or ETO. The cells were then subjected to apoptosis analysis using PI and the Annexin-V double staining method. A portion of apoptotic cells (the upper right and bottom right quadrants) were indicated.

