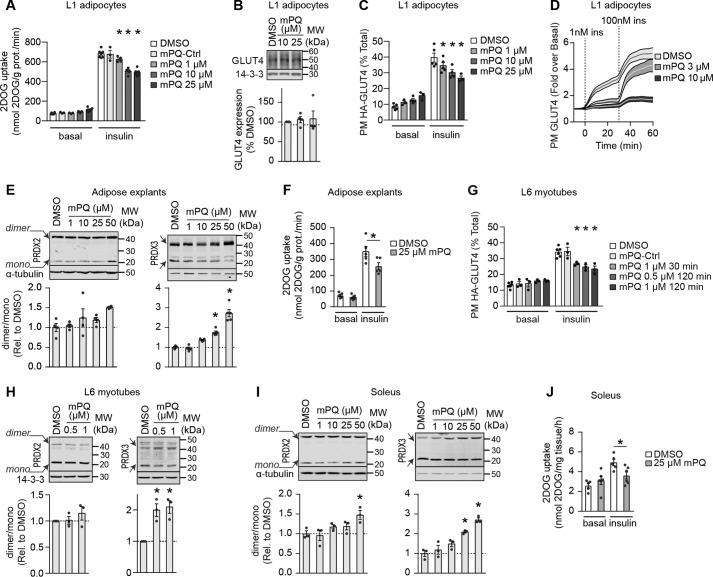
Figure 3.
Mitochondria-targeted paraquat induces insulin resistance. A, 3T3-L1 adipocytes were assayed for 2DOG uptake following treatment with DMSO, MitoPQ-Ctrl, or MitoPQ at specified doses for 2 h and incubated without (basal) or with 100 nm insulin for 20 min (n = 3–4, mean ± S.E. (error bars), two-sample t test corrected for multiple comparisons; *, p < 0.05 versus insulin-stimulated DMSO control). B, GLUT4 levels were assessed by immunoblot. Immunoblots were quantified by densitometry and expressed relative to DMSO-treated cells (indicated by a dotted line) (n = 4, mean ± S.E., one-sample t test). C, 3T3-L1 adipocytes expressing HA-GLUT4 were treated as indicated and assessed for plasma membrane–localized HA-GLUT4 with and without insulin stimulation (n = 3–5, mean ± S.E., two-sample t test corrected for multiple comparisons; *, p < 0.05 versus insulin-stimulated DMSO control). D, 3T3-L1 adipocytes expressing pHlourin-GLUT4 were treated as indicated and assessed for plasma membrane–localized pHlourin-GLUT4 by live-cell total internal fluorescence microscopy as described under “Experimental procedures” (n ≥ 35 cells/condition from two biological replicates, mean ± S.E.). E, epididymal adipose explants were incubated with MitoPQ at the indicated doses for 2 h, and PRDX2 and -3 dimer/monomer ratios were assessed by immunoblotting. Immunoblots were quantified by densitometry and normalized to DMSO-treated explants (n = 3–4, mean ± S.E., two-sample t test corrected for multiple comparisons; *, p < 0.05 versus DMSO control). F, adipose tissue explants were incubated for 2 h in the presence of DMSO or 25 μm MitoPQ and assayed for 2DOG uptake following incubation without (basal) or with 10 nm insulin for 20 min (n = 5, mean ± S.E., two-sample t test; *, p < 0.05 versus insulin-stimulated DMSO control). G, L6 myotubes expressing HA-GLUT4 were treated with DMSO, MitoPQ-Ctrl, or MitoPQ at the specified doses, and insulin responses were assessed by determining plasma membrane–localized HA-GLUT4 (n = 3–5, mean ± S.E., two-sample t test corrected for multiple comparisons; *, p < 0.05 versus insulin-stimulated DMSO control). Incubation times with MitoPQ were as indicated. H, PRDX2 and -3 dimer/monomer ratios were assessed in L6 myotubes treated with DMSO or MitoPQ for 30 min by immunoblot. Immunoblots were quantified by densitometry and normalized to untreated cells (indicated by the dotted line) (n = 5, mean ± S.E., one-sample t test; *, p < 0.05). I, isolated soleus muscle was incubated with DMSO or MitoPQ at the indicated doses for 1 h, and PRDX2 and -3 dimer/monomer ratios were assessed by immunoblotting. Immunoblots were quantified by densitometry and normalized to DMSO-treated muscle (n = 3–4, mean ± S.E., two-sample t test corrected for multiple comparisons; *, p < 0.05 versus DMSO control). J, isolated soleus muscle was incubated for 1 h in the presence of DMSO or 25 μm MitoPQ and assayed for 2DOG uptake following incubation without (basal) or with 10 nm insulin for 20 min (n = 5–6, mean ± S.E., two-sample t test; *, p < 0.05 versus insulin-stimulated DMSO control).

