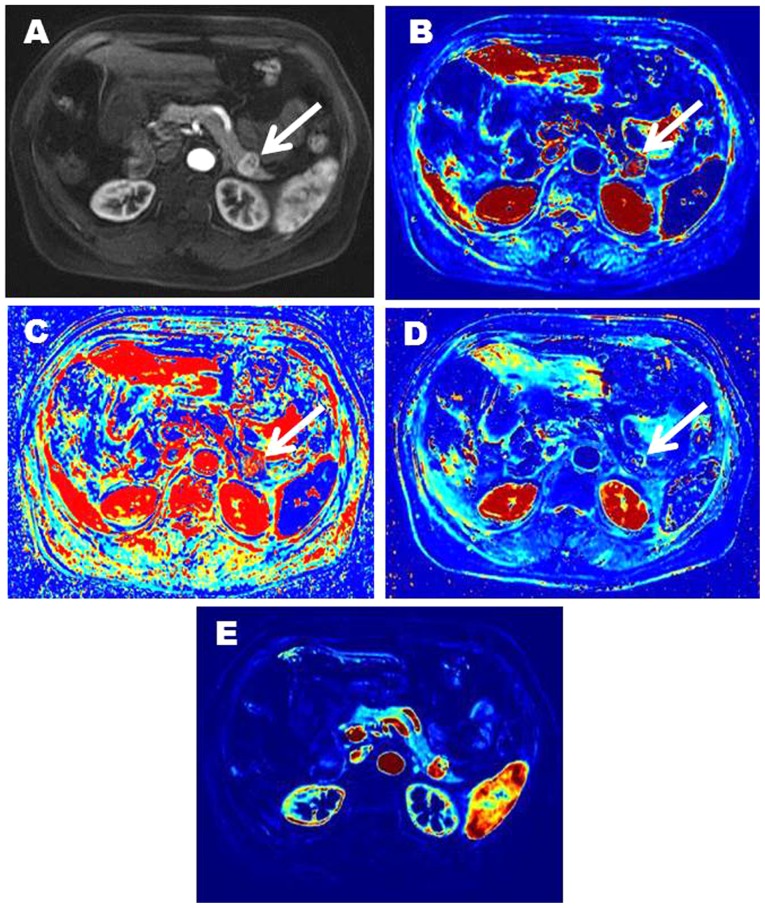
Figure 3.
Representative imaging characteristics in a 68-year-old female patient with G1 NET in the tail of pancreas (white arrow). (A; contrast enhanced image) shows a markedly enhanced lesion in the tail of pancreas. (B) is Ktrans image (Ktrans=0.599). (C) is kep image (kep=1.441). (D) is ve image (ve=0.416). (E) is vp image (vp=0.463). NET, neuroendocrine tumor; Ktrans, volume transfer constant; kep, contrast transfer rate constant; ve, extravascular extracellular space volume fraction; vp, plasma volume fraction.

