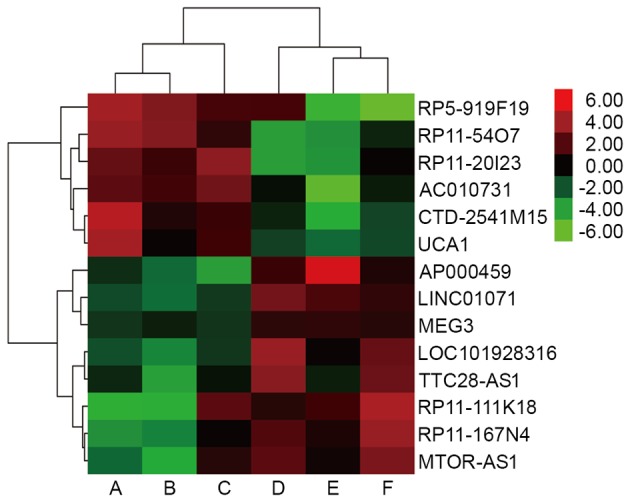
Figure 1.

Clustering analysis diagram of the microarray results. Red indicates upregulated lncRNA expression and green indicates downregulated lncRNA expression. A-C are the groups of gastric cancer tissues, and D-F are the groups of adjacent non-tumor tissues. lncRNA, long non-coding RNA; CTD-2541M15, MCPH1 antisense RNA 1; UCA1, urothelial carcinoma-associated 1; LINC01071, tumor suppressor candidate 8; MEG3, maternally expressed 3; TTC28-AS1, TTC28 antisense RNA 1; MTOR-AS1, MTOR antisense RNA 1.
