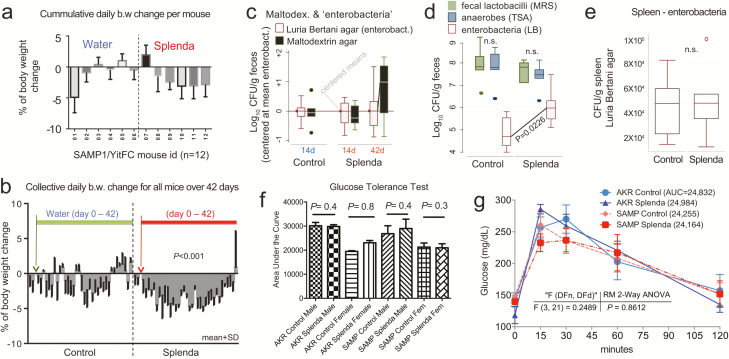
FIGURE 3.
Effects of Splenda on body weight, fecal bacteria, and glucose tolerance in SAMP mice. A, Mean body weight change in 12 SAMP mice (individually caged, 7 days of adaptation, more than 42 days of supplementation of drinking water with and without low-dose Splenda). B, Daily group average of body weight change over time; low Splenda dose. C, Bacterial enumeration from feces using standard LB agar (used for enterobacteria) and in-house “maltodextrin agar.” Notice maltodextrin agar yielded an increasing bacterial count trend toward the end of study in the Splenda group (GLM P > 0.05; relative to centered log-transformed data for LB agar). Supplementary Figure 1 illustrates other in-house agars, yeast extract agar, and Splenda agar yielding similar trends, compared with LB agar. D, Total number of anaerobes (TSA), lactobacilli (MRS agar), and enterobacteria (LB) after 42 days of Splenda supplementation in SAMP mice (unpaired t test, n = 6/group). E, The total number of enterobacteria in the spleen suggests that Splenda had no systemic bacteremic effect. F, Glucose tolerance test on day 40 with animals with Splenda supplementation in experiment 2 (high FDA-approved dose). Notice the lack of significant effect across experimental mice. G, Glucose tolerance test curves illustrated as mean ± SD. Univariate analysis across time points showed no differences due to Splenda. Abbreviation: AUC, area under the curve (n = 6 mice/group).

