FIGURE 5.
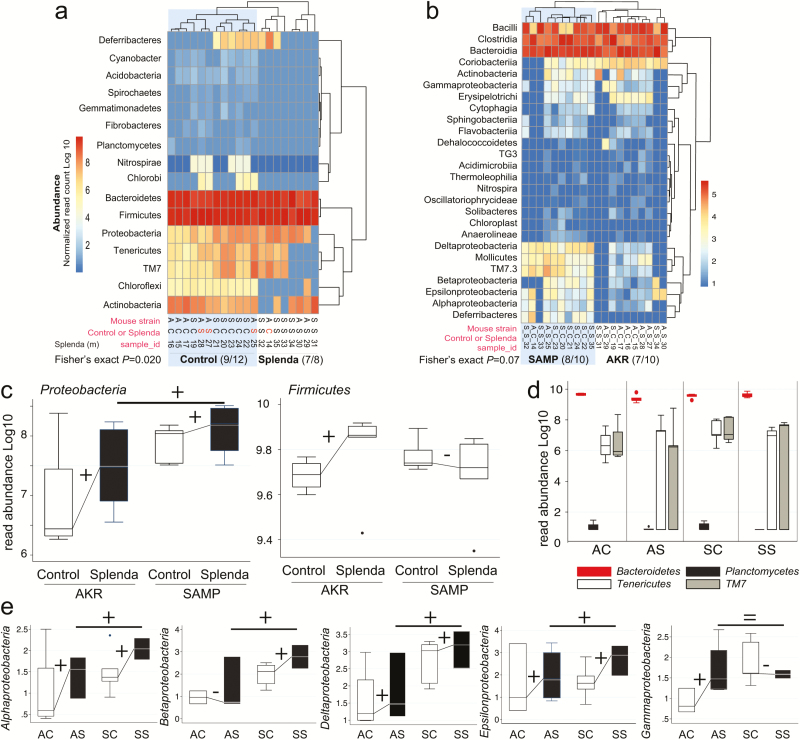
Splenda promotes gut dysbiosis characterized by enrichment of Proteobacteria in mice. A, Phylum analysis. 16S rRNA gene copy microbiome abundance normalized and presented as an unsupervised clustered hierarchical heat map that illustrates a significant effect attributable to Splenda (increase in Proteobacteria and reduction of other phyla including Chloroflexi; P = 0.02). Note the high relative abundance of Bacteroidetes with respect to Firmicutes. Notice that when present several proteobacterial classes contribute to microbiome separation between SAMP and AKR (P = 0.07). Notice highly abundant Bacteroidia, Bacilli, and Clostridia cluster at the top of the panel. C, Boxplot illustrates the effect of Splenda on phylum Proteobacteria, compared with Firmicutes. Lines connecting normalized averages indicate positive trends. D, Boxplot illustrates high Bacteroidetes abundance and the comparative reduction of other phyla in Splenda-treated mice. E, Bacterial abundance across all 5 Proteobacteria classes detected in the study. Sign binomial statistics of means in log10 scale suggests that Splenda promotes a positive effect (including (C); 10/12 were positive, 2/12 were negative, 1-tail sign P = 0.019). Abbreviations, C, control water; diet S, Splenda; mouse A, AKR/J; S, SAMP. B, Class analysis.

