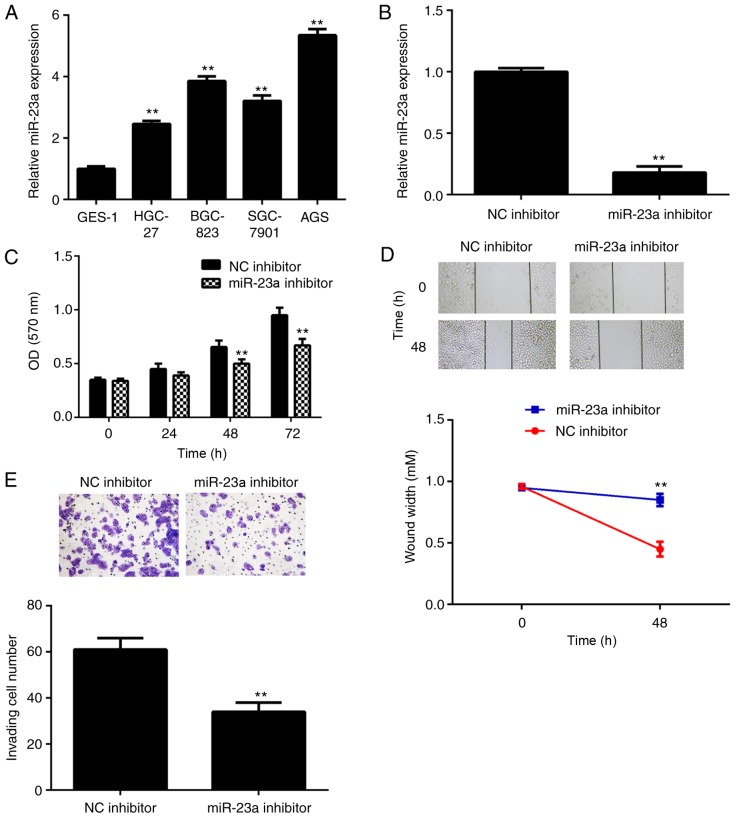
Figure 2.
(A) RT-qPCR was conducted to examine the miR-23a levels in gastric cancer cell lines, compared with normal gastric mucosa epithelial GES-1 cells. **P<0.01 vs. GES-1. Following this, AGS cells were transfected with miR-23a inhibitor or NC inhibitor. (B) RT-qPCR was conducted to examine the miR-23a levels. (C) MTT assay, (D) wound healing assay and (E) Transwell assay were conducted to examine cell proliferation, migration and invasion, respectively. **P<0.01 vs. NC inhibitor. The magnifications for the wound healing and Transwell assay images were ×40 and ×200, respectively. RT-qPCR, reverse transcription-quantitative polymerase chain reaction; NC, negative control; miR, microRNA; OD, optical density.

