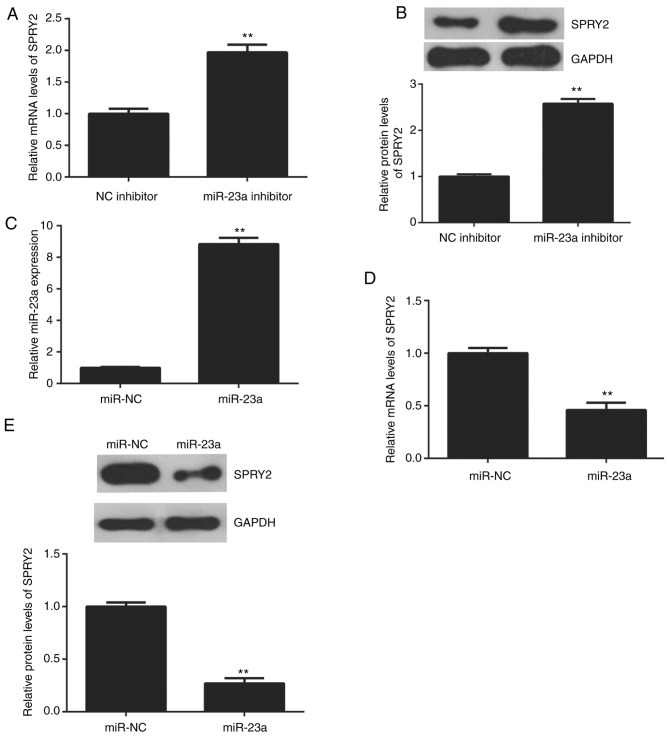
Figure 4.
(A) RT-qPCR and (B) western blot analysis were conducted to examine the mRNA and protein levels in AGS cells transfected with miR-23a inhibitor or NC inhibitor. **P<0.01 vs. NC inhibitor. Following this, AGS cells were transfected with miR-23a mimic or scramble miR mimic, miR-NC. Following transfection, (C) RT-qPCR was conducted to examine the miR-23a levels. Then, (D) RT-qPCR and (E) western blot analysis were conducted to determine the mRNA and protein levels of SPRY2. (C-E) **P<0.01 vs. miR-NC. NC, negative control; RT-qPCR, reverse transcription-quantitative polymerase chain reaction; SPRY2, sprouty homolog 2; miR, microRNA.

