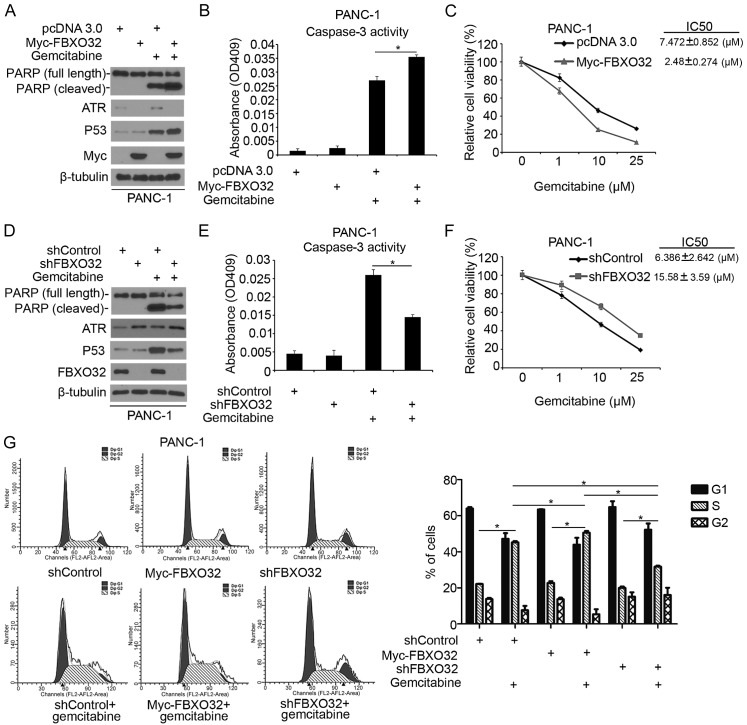
Figure 4.
FBXO32 regulates the DNA damage response induced by gemcitabine in pancreatic cancer. PANC-1 cells were transfected with indicated constructs. Cells were treated with gemcitabine (10 µM) for 24 h prior to harvest. Cells were harvested for (A) western blot analysis and (B) measurement of caspase-3 activity. Data are presented as the mean ± standard deviation of two replicate experiments. *P<0.05 for pcDNA 3.0+gemcitabine treatment vs. Myc-FBXO32+ Gemcitabine treatment. (C) PANC-1 cells were transfected with indicated constructs. Cells were treated with different concentrations (0, 1, 10 and 25 µM) of gemcitabine for 24 h prior to measurement. Cell viability was measured using an MTS assay. Data are presented as the mean ± standard deviation of three replicate experiments. PANC-1 cells were transfected with control or one of two independent FBXO32-specific shRNAs. At 24 h after transfection, cells were treated with gemcitabine (10 µM) for 24 h prior to harvest. Cells were harvested for (D) western blot analysis and (E) measurement of caspase-3 activity. Data are presented as the mean ± standard deviation of two replicate experiments. *P<0.05 for shControl+gemcitabine treatment vs. shFBXO32+gemcitabine treatment. (F) PANC-1 cells were transfected with control or one of two independent FBXO32-specific shRNAs. At 24 h after transfection, cells were treated with different concentrations (0, 1, 10 and 25 µM) of gemcitabine for 24 h prior to measurement. Cell viability was measured using an MTS assay. Data are presented as the mean ± standard deviation of three replicate experiments. (G) PANC-1 cells were transfected with indicated constructs. Cells were treated with distilled water or gemcitabine (20 µM) for 24 h. The cell cycle was analyzed after staining with PI. The cell cycle distribution was analyzed using ModFit LT software. Data from a representative experiment (from a total of two) are presented. Student's t-test was performed for single comparisons and one-way analysis of variance, followed by Tukey's multiple comparisons test was performed for multiple comparisons. *P<0.05 for comparing S phase in groups as follows: shControl vs. shControl+gemcitabine treatment, Myc-FBXO32 vs. Myc-FBXO32+gemcitabine treatment, shFBXO32 vs. shFBXO32+gemcitabine treatment, shControl+gemcitabine treatment vs. Myc-FBXO32+gemcitabine treatment, shControl+gemcitabine treatment vs. shFBXO32+gemcitabine treatment, Myc-FBXO32+gemcitabine treatment+shFBXO32+gemcitabine treatment.

