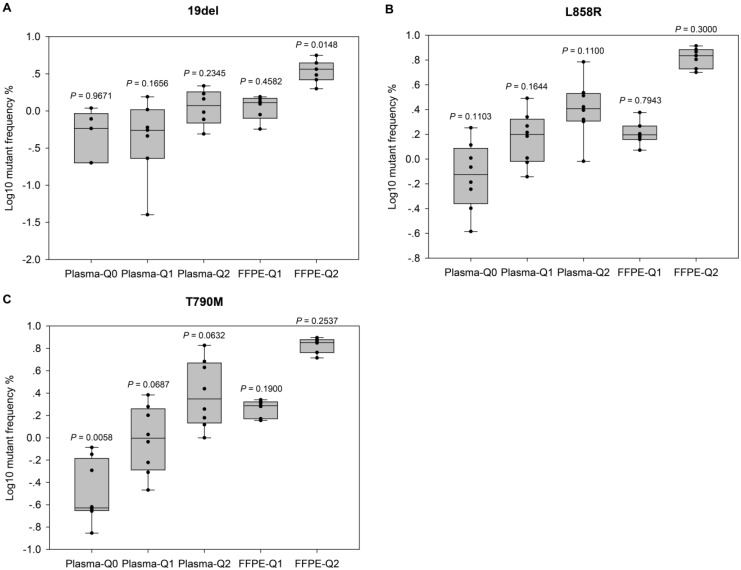
Figure 2.
Evaluation of the performance of NGS-based cancer IVDs. Evaluation of the performance of NGS in detecting EGFR (A) 19del, (B) L858R, and (C) T790M mutations. Allelic frequencies are expressed as Log10 values. Each dot represents the result of a single participant. The inter-quartile ranges are shown as box-and-whisker plot. Values shown above each column indicate the P value of one-sample t-test (with the mean value of ddPCR results as the theoretical value).

