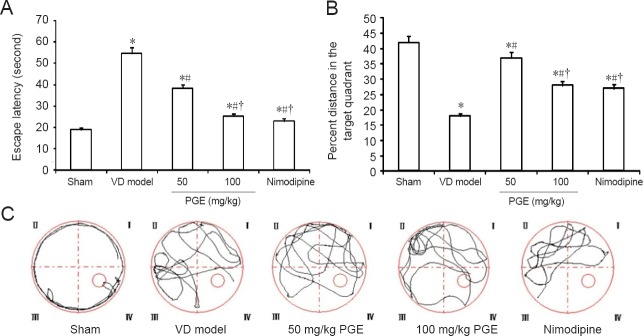
Figure 1.
Effect of PGE on performance in the Morris water maze.
(A) Escape latency in the training trials. (B) Percent distance in the target quadrant in the probe trials. (C) Representative pathways on the last day of training trials. Data are shown as the mean ± SD (n = 20; one-way analysis of variance followed by Student's t-test). *P < 0.05, vs. sham group; #P < 0.05, vs. VD model group; †P < 0.05, vs. 50 mg/kg PGE group. PGE: Panax ginseng extract; VD: vascular dementia.

