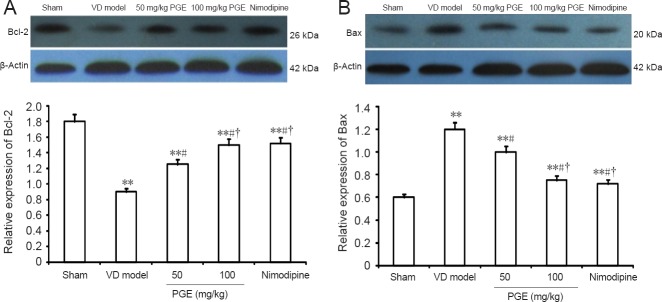
Figure 5.
Western blot assay for Bax and Bcl-2 protein expression in the hippocampus.
Expression was calculated as the ratio of the optical density of the target protein to that of β-actin. Values are presented as the mean ± SD (n = 10; one-way analysis of variance followed by Student's t-test). **P < 0.01, vs. sham group; #P < 0.05, vs. VD model group; †P < 0.05, vs. 50 mg/kg PGE group. PGE: Panax ginseng extract; VD: vascular dementia.

