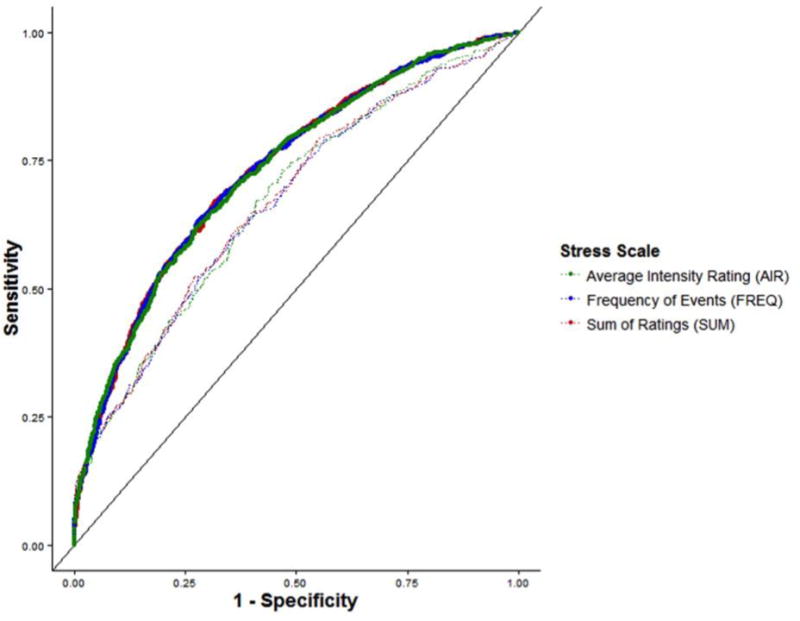
Figure 1.

The utility of the forecasting model to discriminate between future headache and non-headache attacks is displayed using ROC curves. The three stress models based on three different subscales of the Daily Stress Inventory are depicted using dark lines. The internal validation of each of these models is displayed using dotted lines. Each of the models forecasted headaches with similar utility, and exhibited similar internal validation performance.
