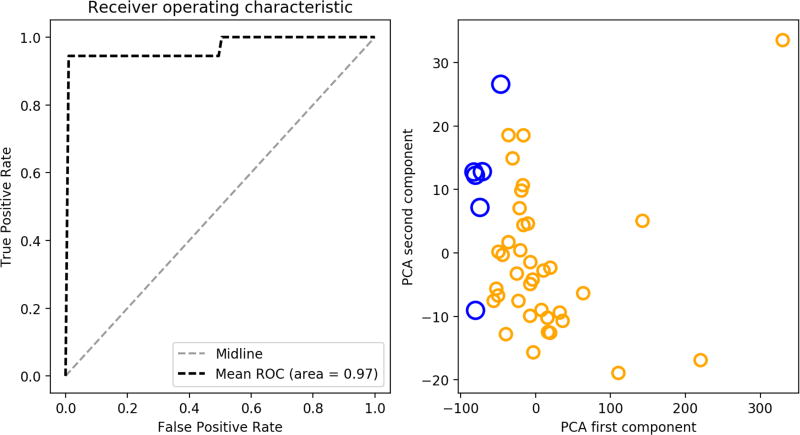
Figure 6.
Preliminary data analysis results (left) mean ROC curve of a 3-fold cross validation with a 0.97 are under the curve (right) class discrimination by plotting the first two components of PCA done on the 4-dimensional features. Healthy (blue dots) and simulated (yellow dots) samples have very distinct variability values

