
Figure 6. Risk map prototype illustrating estimated relative risk of ischemic heart disease mortality attributable to fine particulate matter air pollution by location in New York City in 2014.
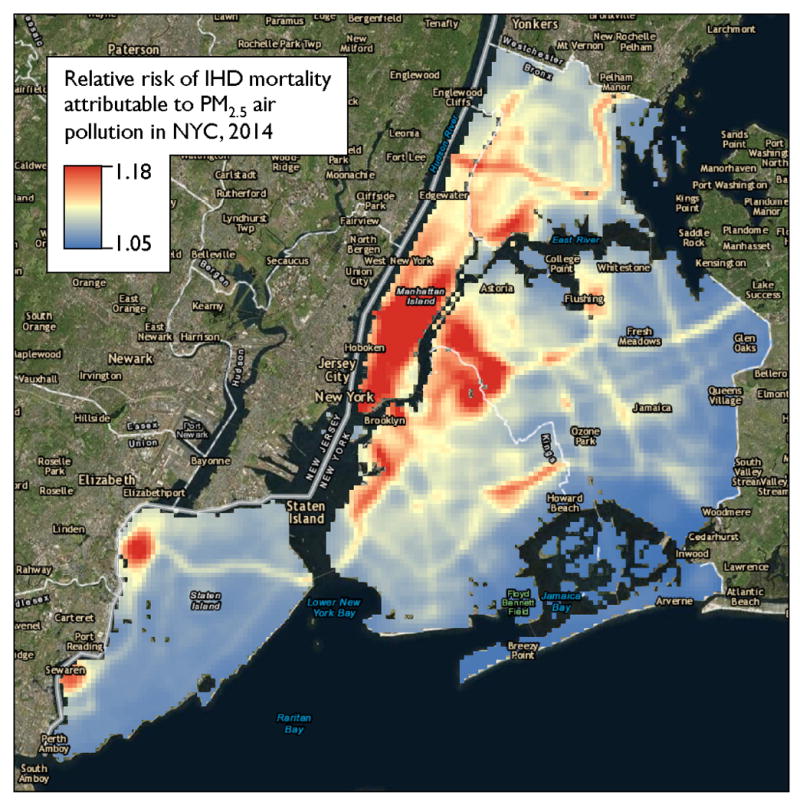
This searchable risk map enables clinicians to estimate PM2.5 exposure and attributable risk of ischemic heart disease mortality based on location in New York City. The risk map combines a frequently cited exposure-response curve11 with annual average PM2.5 concentration estimates based on a land-use regression model.61, 62 These risk estimates apply to populations and may not be predictive of individual risk. Exposure estimates used with permission from The New York City Department of Health and Mental Hygiene, Queens College Center for the Biology of Natural Systems, and Zev Ross Spatial Analysis.