. 2015 Sep 22;6(12):7238–7248. doi: 10.1039/c5sc02401c

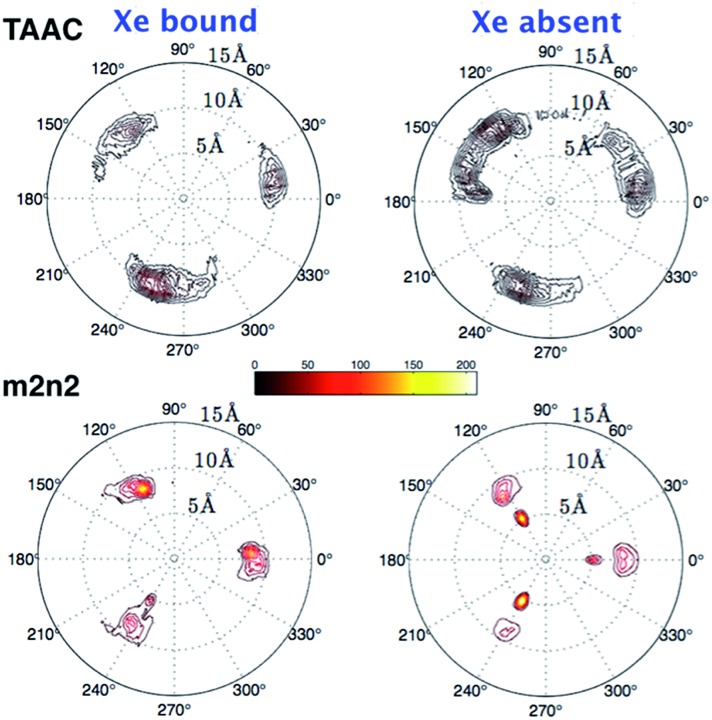
Fig. 10. Polar contours for distribution of counter ions. The left and right columns are the polar distributions of counter ions when λ = 0 and λ = 1, respectively. The origin is set at the center of mass of the 36 aromatic carbon atoms of the cryptophane; the xy plane is perpendicular to the vector connecting the two centers of mass of the top and bottom caps, and the x axis is the projection of the vector connecting the origin and the average position of two phenol oxygen atoms on the same linker. On the contour plot, the radial coordinate r is the distance between the origin and a counter ion; θ is the angle between the x axis and the projection of r on the xy plane. Color scale bar is shown above for g(r,θ).

Fig. 10