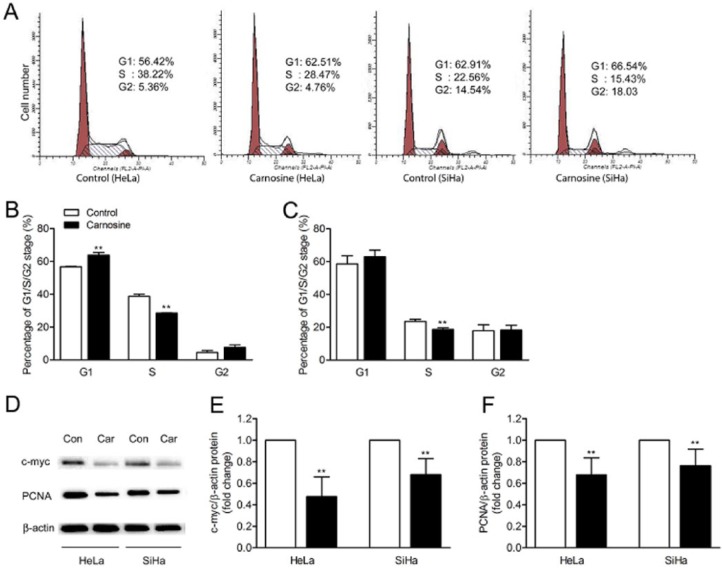
Figure 7.
Carnosine inhibited cell cycle progression in cultured HeLa and SiHa cells. The HeLa and SiHa cells were treated with carnosine (20 mM) for 48 hours, and then the cell cycle distribution was measured by flow cytometry. Representative images of cell cycle progression analysis in cultured HeLa and SiHa cells (A). Statistical analysis of percentage of cells in each cell cycle phase in cultured HeLa cells (B) and SiHa cells (C). Western blot analysis of the expression level of c-Myc and PCNA in HeLa and SiHa cells after carnosine treatment for 48 hours (D). Densitometric analysis of bands for relative c-Myc (E) and PCNA (F) protein expression level. Data were shown as mean ± SD. **P < .01 versus control group.

