
Figure 1.
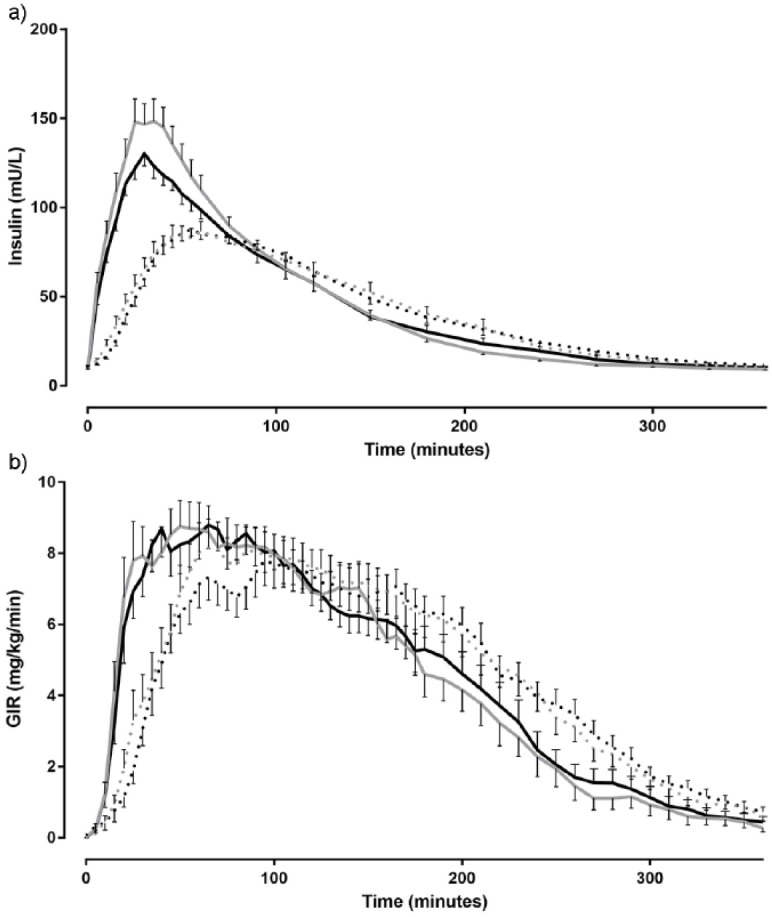
Mean plasma insulin levels (a) and glucose infusion rates (b) after insulin injection by the jet injector (solid line) and conventional pen (dashed line) on day 1 (black line) and day 2 (gray line) during the euglycemic glucose clamp.
Official websites use .gov
A
.gov website belongs to an official
government organization in the United States.
Secure .gov websites use HTTPS
A lock (
) or https:// means you've safely
connected to the .gov website. Share sensitive
information only on official, secure websites.
Mean plasma insulin levels (a) and glucose infusion rates (b) after insulin injection by the jet injector (solid line) and conventional pen (dashed line) on day 1 (black line) and day 2 (gray line) during the euglycemic glucose clamp.