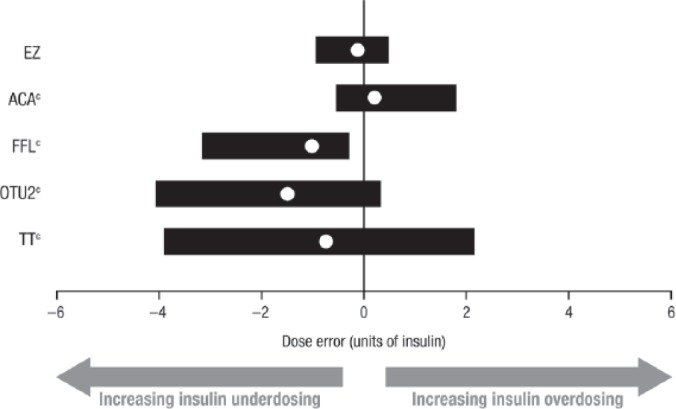
Figure 1.

Middle (median) 95% distribution of bolus insulin dose errors (Clinical Trial 1).a,b
BGMS, blood glucose monitoring system; YSI, YSI glucose analyzer.
aThe insulin sensitivity input (1/25) and the insulin:carbohydrate ratio (1/15) were adjusted based on the observed error of the BGMS result versus the YSI measurement.
bSolid white circles represent the median dose error; horizontal bars represent the 95% dose error range.
cP <0.0001 versus EZ (Kolmogorov-Smirnov test).
